
Lightrun Answers was designed to reduce the constant googling that comes with debugging 3rd party libraries. It collects links to all the places you might be looking at while hunting down a tough bug.
And, if you’re still stuck at the end, we’re happy to hop on a call to see how we can help out.
VS code does not send 'start' command when a debugging session begins
See original GitHub issueIssue Type: Bug
Your environment
vscode-rubyversion: 0.27.0- Ruby version: 2.6.6
- Ruby version manager (if any): chruby
- VS Code version: Code 1.49.0 (e790b931385d72cf5669fcefc51cdf65990efa5d, 2020-09-10T17:39:53.251Z)
- Operating System: Mac OS Darwin x64 19.6.0
- Using language server? yes
Hello! I’ve been really digging into how VS code does native debugging and I believe I’ve found a bug!
Unfortunately, I’m not able to reproduce this issue myself - it only appears on my teammate’s machine. I’ve been the one investigating the issues with debugging, so I’m submitting the bug report here. We verified together that we are using the same versions of vscode-ruby, ruby, chruby, mac, and vscode.
We’ve found that VS code does not send the start command when a debugging session begins. In our case, that causes execution of the process we’re attempting to debug to hang.
Reproduction steps
Here are the reproduction steps (some of which are probably extraneous to the issue, but they’re what I’ve been doing to repro the issue):
1. Get ruby-debug-ide set up
We’re running ruby 2.6.6, but I doubt that makes a difference
gem install ruby-debug-ide
gem install debase
These gems provide the ability to debug a ruby executable by starting a server that can communicate with VS code’s debugging functionality.
2. Install the Ruby extension in VS code
You can see below that I’m using version 0.27.0
3. Add a new launch config to launch.json
{
      "name": "Attach to debug ruby",
      "type": "Ruby",
      "request": "attach",
      "remoteHost": "127.0.0.1",
      "remotePort": "1235",
      "remoteWorkspaceRoot": "${workspaceRoot}",
      "showDebuggerOutput": true
}
4. Start the ruby debug server
rdebug-ide --host 0.0.0.0 --port 1235 --debug -- echo "hello"
rdebug-ide is the binary installed with the ruby-debug-ide gem
--host and --port specify the host and port used to connect to the server. Note we’re using the same values in the launch config and the command above.
--debug tells ruby-debug-ide to output verbose logs
-- is a delimiter that specifies that what follows is an executable to run and not another option.
echo "hello" is the command we’re going to debug. This isn’t a ruby command, but that doesn’t matter. If all works properly, ruby-debug-ide will try to run this command, fail, and print some output to that effect. That’s what we want to have happen since it means the connection between vscode and ruby-debug-ide has been successful. If that output is not produced, we know the connection between the two has not been successful.
5. Attach the VS code debugger
Open the debugger pane in VS code. Select the launch configuration with the title Attach to debug ruby. Press play and attempt to attach
Expected
VS code should attach to the running instance of ruby-debug-ide. Then VS code will send the start command, which will in turn run the command it was given (echo "hello"), and fail because it can’t find the binary echo within the local directory.
Actual
VS code attaches to the running instance of ruby-debug-ide. VS code does not send the start command. Execution of ruby-debug-ide hangs because it is waiting for start in order to run the executable it has been given.
Determining which commands were sent
I was able to inspect data being sent between the server (ruby-debug-ide) and the client (VS code) using Wireshark.
Successful run
Here is a screenshot of VS code sending the start command as it should, given the reproduction steps above. successful-packets.txt (and a plaintext dump of wireshark output that’s a bit hard to read)
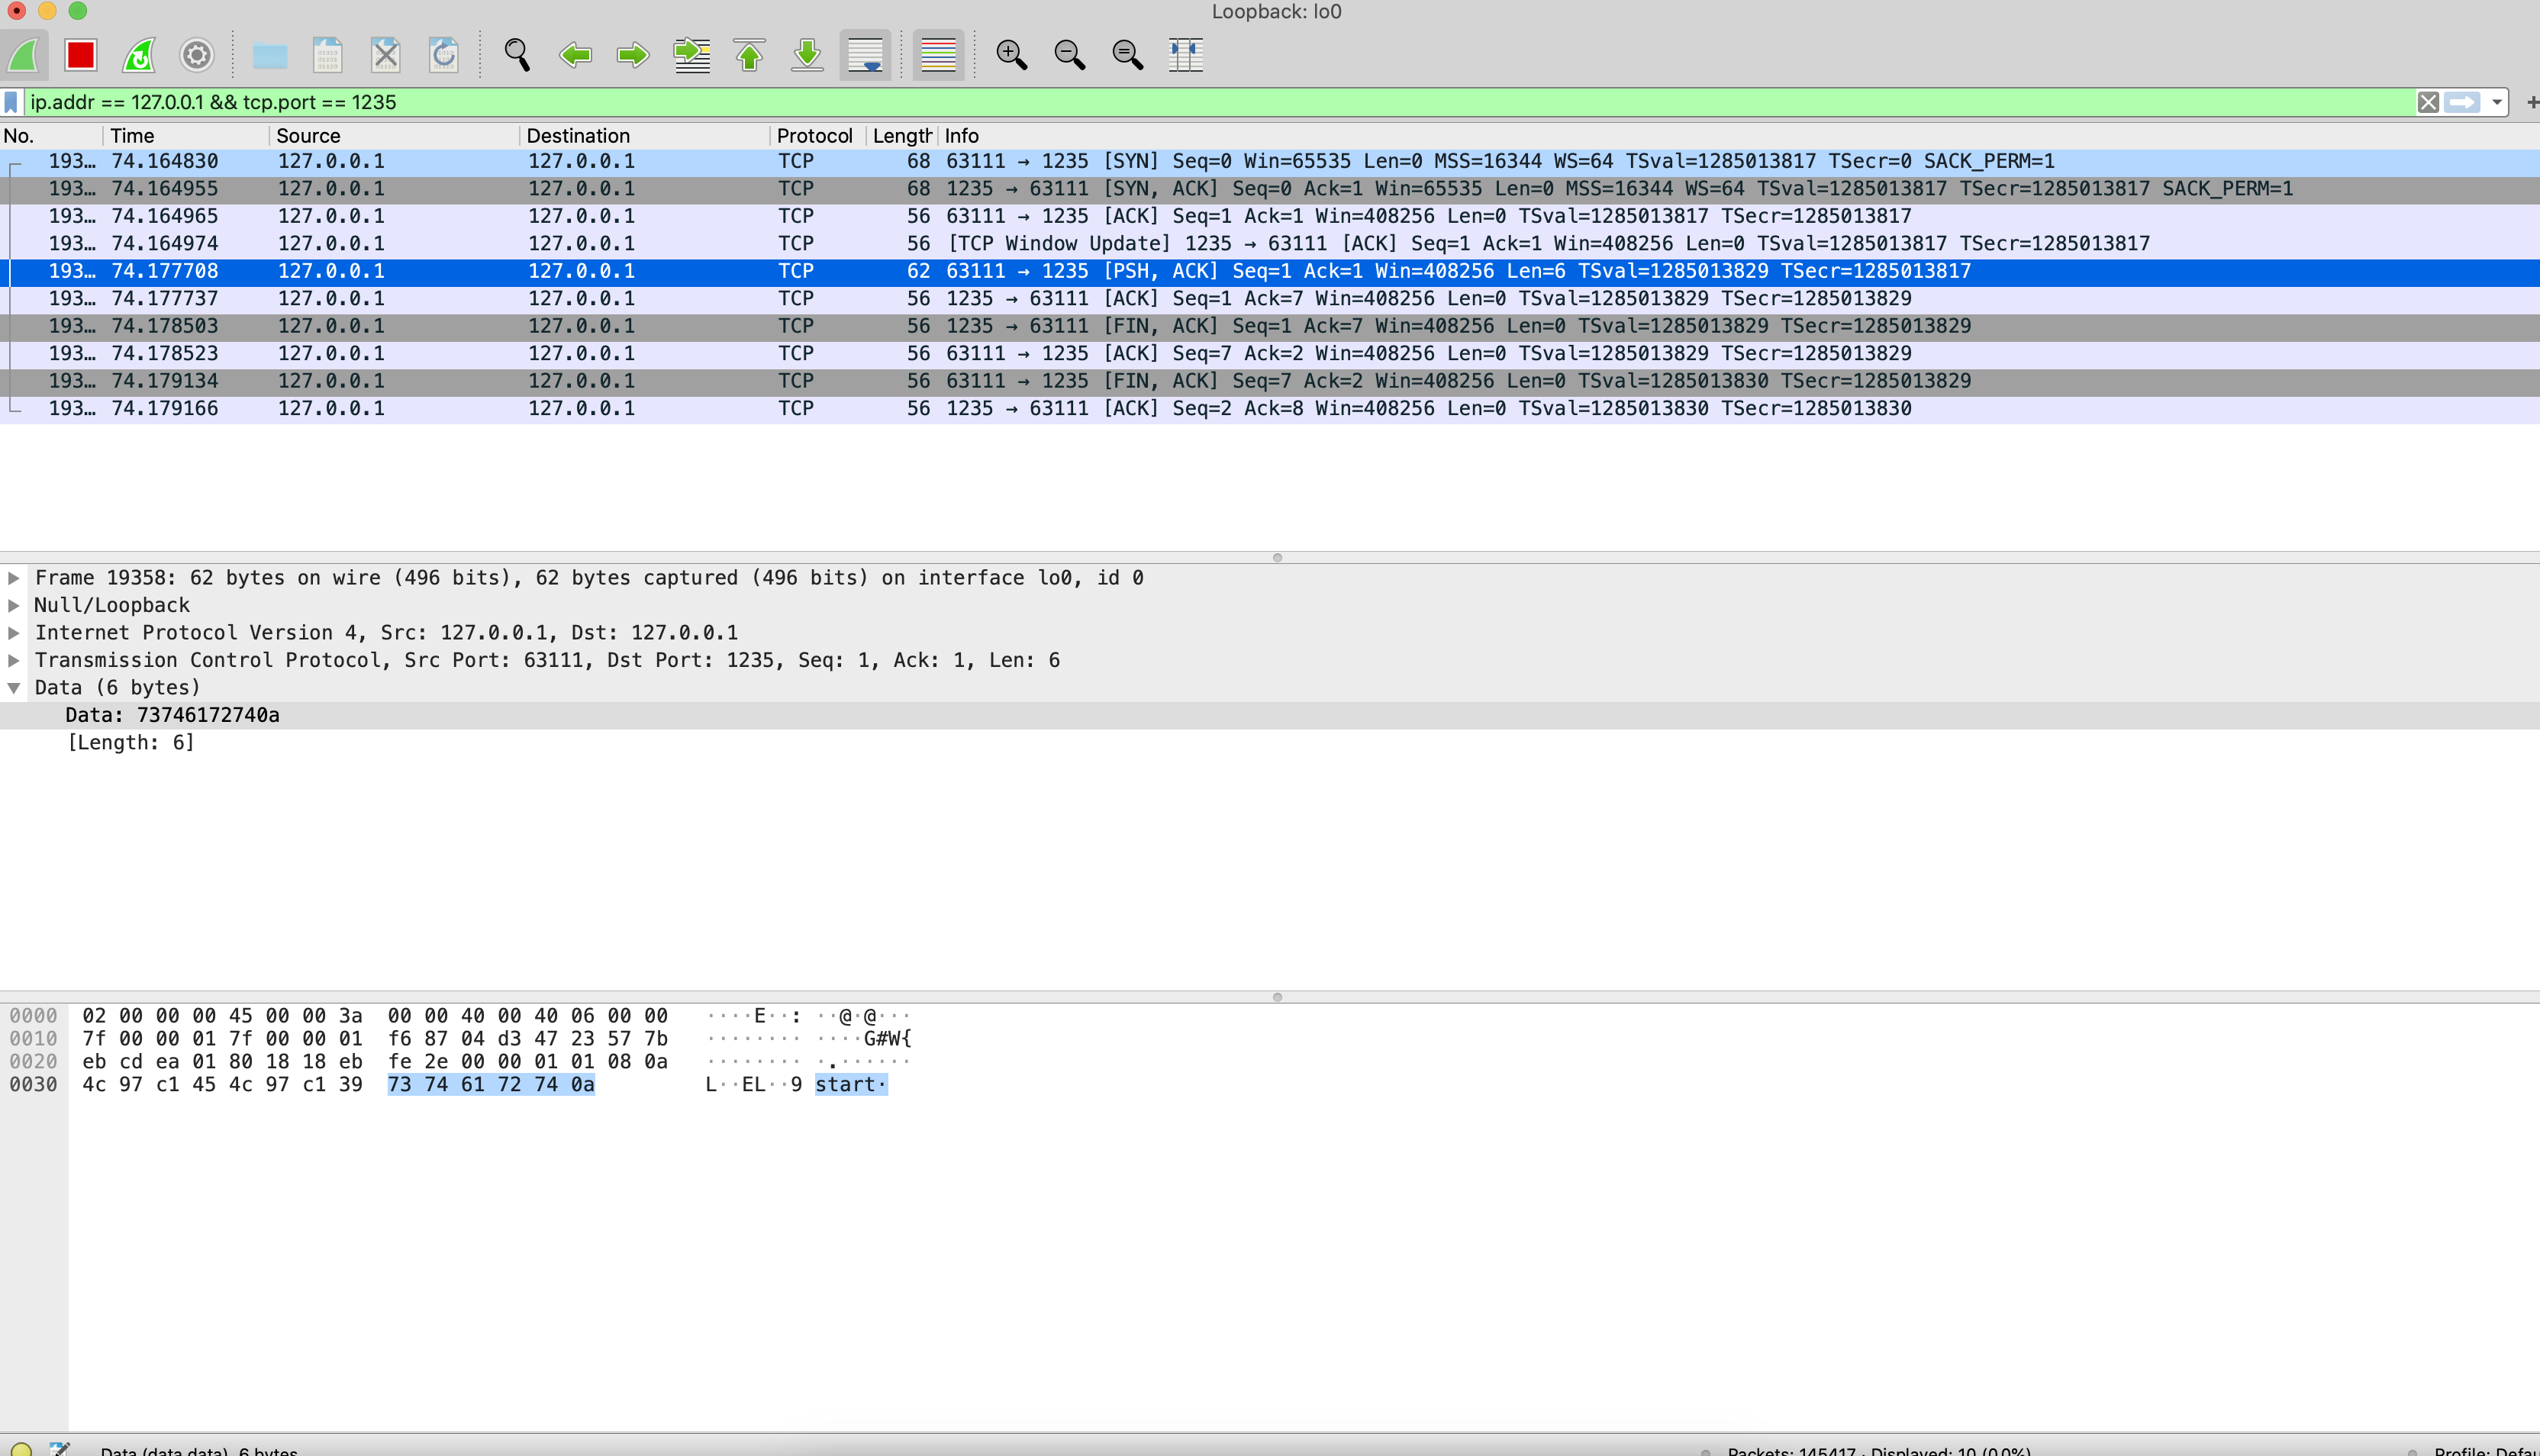
VS code is using the port 63111.
ruby-debug-ide is using the port 1235
The first three packets there are the TCP handshake (SYN, SYN/ACK, ACK) between the client and the server. The third is a TCP Window Update (not sure what that’s doing, honestly).
The fifth packet is the important one. That contains the start command from VS code to ruby-debug-ide.
Unsuccessful run
Here is a screenshot of VS code not sending the start command (from my teammate’s machine) unsuccessful-start-packets.txt
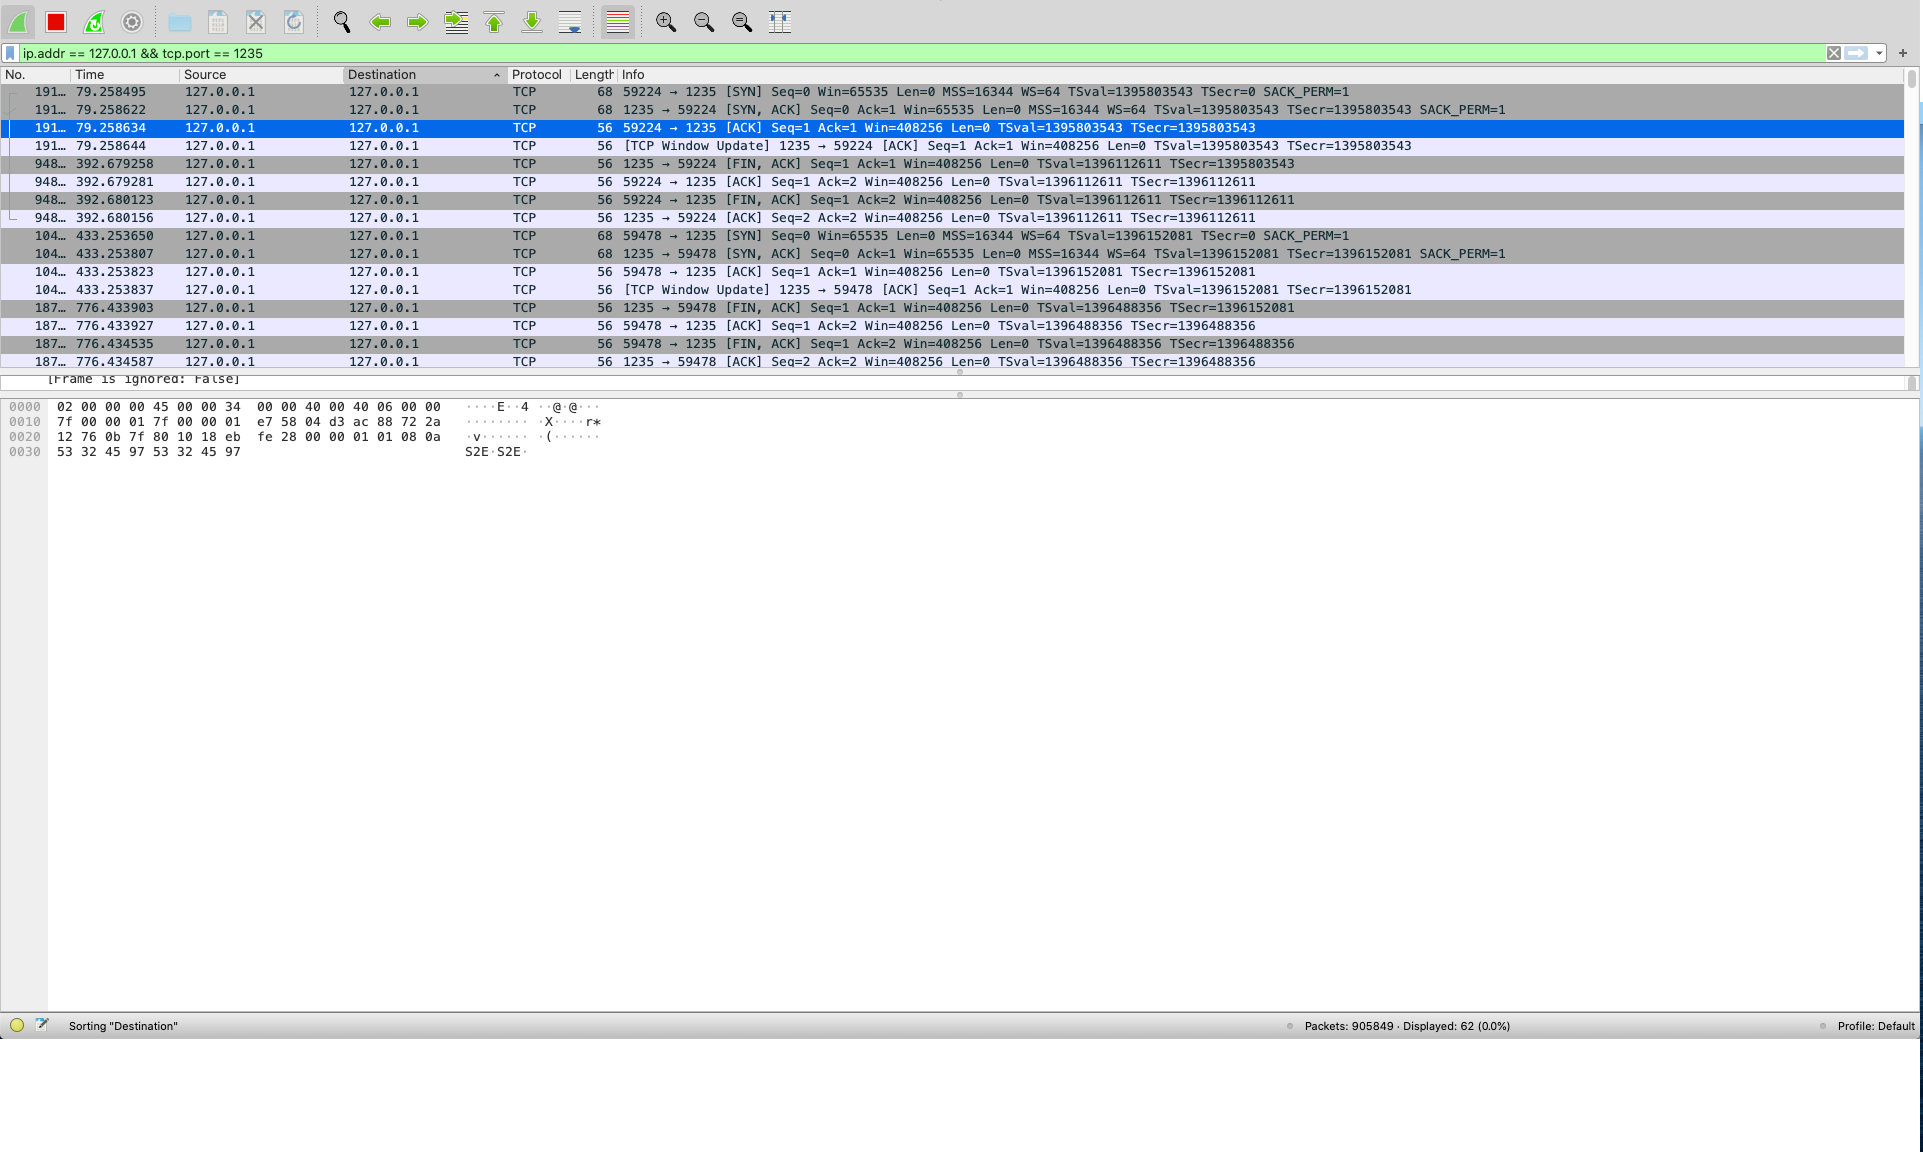
Notice that the fifth packet is not the same - it is not a PSH packet with the send command.
Closing thoughts
I know this is a long bug report, but I wanted to include everything that might be useful so I wouldn’t forget later. Thanks so much for your help! I’m happy to assist in debugging the problem further 😃
Issue Analytics
- State:

- Created 3 years ago
- Reactions:1
- Comments:6 (2 by maintainers)
 Top Related StackOverflow Question
 Troubleshoot Live Code
 Top Related Reddit Thread
 Top Related Hackernoon Post
 Top Related Tweet
 Top Related Dev.to Post
 Top Related Hashnode Post
Thanks for investigating this, btw; this thread helped me connect the dots!
Well now that I’m looking at the screenshot of the unsuccessful case, I see that the fifth packet sent is
[FIN, ACK]from1235 -> 59224(ruby-debug-ideto vscode), which meansruby-debug-ideis requesting that the connection be closed. 🤔So perhaps the issue is with
ruby-debug-ide🤯