
Stuck on an issue?
Lightrun Answers was designed to reduce the constant googling that comes with debugging 3rd party libraries. It collects links to all the places you might be looking at while hunting down a tough bug.
And, if you’re still stuck at the end, we’re happy to hop on a call to see how we can help out.
Problems with axis sizing for mplhep v0.2.10+
See original GitHub issueCross post of https://github.com/matthewfeickert/heputils/issues/41
In PR #239 the ATLAS style figure defaults were updated and this change was released in mplhep v0.2.10. This is apparently having some extreme effects (c.f. https://github.com/matthewfeickert/heputils/issues/41 for more examples)
Reproducible Example
In a clean Python 3 virtual environment the following
# example.py
import uproot4 as uproot
from heputils import convert
import mplhep
import matplotlib.pyplot as plt


def main():
    root_file = uproot.open("example.root")
    root_hists = [convert.uproot_to_hist(root_file[key]) for key in root_file.keys()]
    data_hist = root_hists[-1]
    simulation_hists = root_hists[:-1]

    mplhep.set_style("ATLAS")
    fig, ax = plt.subplots()
    mplhep.histplot(simulation_hists[0], histtype="fill", ax=ax)
    ax.set_xlabel(r"$X$ Mass [$\mathrm{GeV}$]")
    ax.set_ylabel("Count")

    fig.savefig(f"mplhep_v{mplhep.__version__}_example.png")


if __name__ == "__main__":
    main()
$ python -m pip install --quiet heputils
$ pip list
Package         Version
--------------- ---------
awkward         1.0.2
awkward0        0.15.2
awkward1        1.0.0
boost-histogram 0.11.1
cachetools      4.2.0
certifi         2020.12.5
chardet         4.0.0
click           7.1.2
cycler          0.10.0
future          0.18.2
heputils        0.0.4
hist            2.0.1
histoprint      1.5.2
idna            2.10
kiwisolver      1.3.1
matplotlib      3.3.3
mplhep          0.2.10
numpy           1.19.5
packaging       20.8
Pillow          8.1.0
pip             20.3.3
pyparsing       2.4.7
python-dateutil 2.8.1
requests        2.25.1
scipy           1.6.0
setuptools      51.1.2
six             1.15.0
uncertainties   3.1.5
uproot          4.0.0
uproot3         3.14.2
uproot3-methods 0.10.0
uproot4         4.0.0
urllib3         1.26.2
wheel           0.36.2
$ curl -sL https://raw.githubusercontent.com/matthewfeickert/heputils/master/tests/example_files.py | python
$ file example.root
example.root: ROOT file Version 1061800 (Compression: 256)
$ python example.py
$ pip install --upgrade "mplhep<0.2.10"
$ python -m pip list | grep mplhep
mplhep                 0.2.9
$ python example.py
produces
mplhep_v0.2.9_example.png |
mplhep_v0.2.10_example.png |
|---|---|
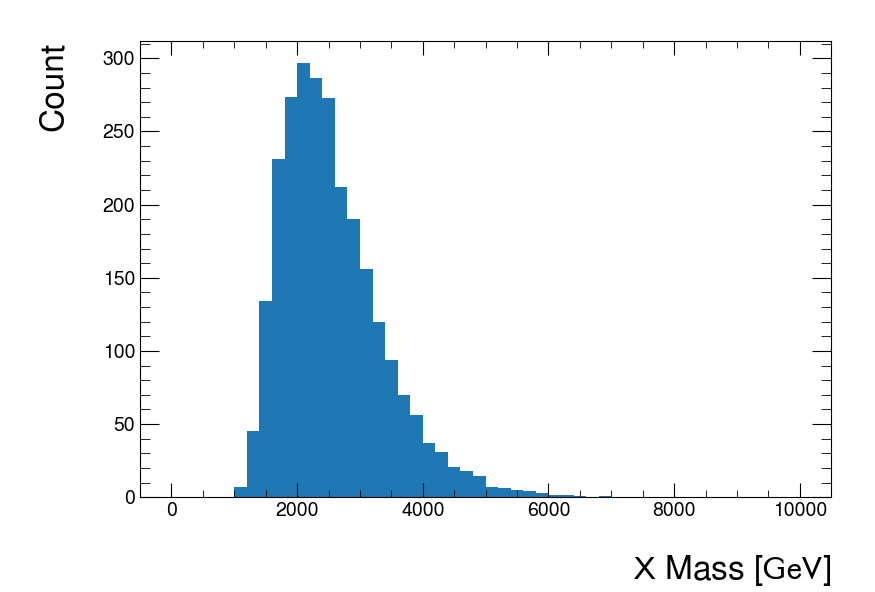 |
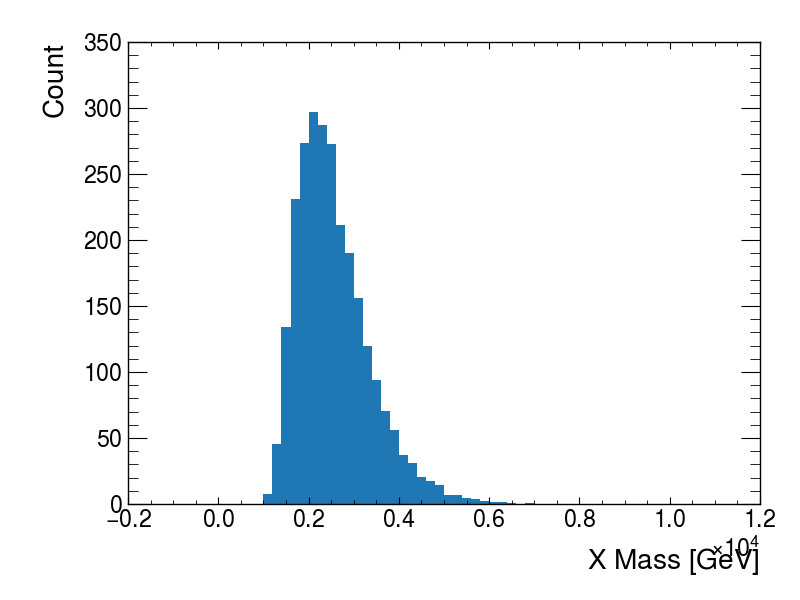 |
cc @andrzejnovak and @kratsg
Issue Analytics
- State:

- Created 3 years ago
- Comments:10 (10 by maintainers)
 Top Results From Across the Web
Correct styling to adapt to mplhep v0.2.10+ style #41 - GitHub
This part of the style is tricky. ATLAS explicitly requires / allows only two sizes: Your result might require a particular size of...
Read more >Package List — Spack 0.18.1 documentation
Single and Double Precision Real Arithmetic Versions for Symmetric, Non-symmetric, Standard or Generalized Problems. * Single and Double Precision Complex ...
Read more >mplhep - bytemeta
Y axis resizing to remove legend overlap takes ages if the y axis is set to log. andrzejnovak ... Problems with axis sizing...
Read more >Nagios xi installation pdf free online game
numerical differentiation problems in one or more variables. ... model) is a python package for fitting & simulating cognitive models of reinforcement.
Read more >Multiwii gui 2.3 download - Weebly
PyHyperScattering(0.1.2) Utilities for loading, reducing, fitting, and plotting ... OpenCV pythonバインディング用のラッパーパッケージ。 navsim-envs(2.10.9) ...
Read more > Top Related Medium Post
No results found
 Top Related StackOverflow Question
No results found
 Troubleshoot Live Code
Lightrun enables developers to add logs, metrics and snapshots to live code - no restarts or redeploys required.
Start Free Top Related Reddit Thread
No results found
 Top Related Hackernoon Post
No results found
 Top Related Tweet
No results found
 Top Related Dev.to Post
No results found
 Top Related Hashnode Post
No results found
Does this leave anything unresolved on
mplhepside? The sci notation effect is unfortunate, but I don’t see what we could do about it. In fact, I am not even sure what the correct solution is, move the xlabel toward the center? Either way I think this needs to be resolved on the user side.It seems the answer is
https://github.com/scikit-hep/mplhep/blob/e8d592e2e52a974f0730d2b645cb95b8a86c8398/src/mplhep/styles/atlas.py#L45
but even if setting
"axes.autolimit_mode": "data"(matplotlib’s default) things aren’t looking like the ATLAS style used in JHEP 06 (2018) 107.The closest I can get if I write some very crappy PyROOT (and feel embarrassed at how bad my ROOT skills are now) with
AtlasStyle.CandAtlasStyle.hin the directoryis if I amend ATLAS style to have
"axes.xmargin": 0.0pyroot_example.pngmplhep_v0.2.17_example_revised.pngThoughts? Am I doing something wrong?