
Lightrun Answers was designed to reduce the constant googling that comes with debugging 3rd party libraries. It collects links to all the places you might be looking at while hunting down a tough bug.
And, if you’re still stuck at the end, we’re happy to hop on a call to see how we can help out.
Add `compositional` to `scipy.stats` for compositional data analysis
See original GitHub issueIs your feature request related to a problem? Please describe. Absolutely. Compositional data analysis [CoDA] is large in fields such as bioinformatics, geology, and economics.
In statistics, compositional data are quantitative descriptions of the parts of some whole, conveying relative information. Mathematically, compositional data is represented by points on a simplex. Measurements involving probabilities, proportions, percentages, and ppm can all be thought of as compositional data. https://en.wikipedia.org/wiki/Compositional_data
Describe the solution you’d like
To have a compositional section in scipy.stats that, at the very least, has common CoDA methods such as closure, center log-ratio, isometric log-ratio, etc. Currently some of the methods are implemented in scikit-bio but I feel that they are much more generalizable to more sciences.
There are also correlation-style pairwise operations that are robust to bias from compositionality. This figure sums up why this is important from Morton et al.
One of the most practical pairwise operations is the rho metric originally published in Lovell et al. 2015, adapted by Erb et al. 2016, and implemented in R by Quinn et al. 2018 in the propr R package. I’ve reimplemented key metrics such as rho, phi, and variance log-ratio in my compositional Python package that have been optimized to make use of vectorization in numpy. rho is a drop-in replacement for correlation where the values range from -1 to 1 and phi is the unscaled version of rho. variance log-ratio is akin to a distance measure I believe.
I would like for these to be integrated into the scipy ecosystem to be more accessible to not only bioinformaticians but geologist and other sciences that use compositional data. Currently, most of the implementations either use many dependencies, do not fully make use of numpy vectorization for speed, or are available only in R.
Describe alternatives you’ve considered
I’ve been using 3rd party packages (scikit-bio and gneiss) and developed my own (https://github.com/jolespin/compositional).
Additional context (e.g. screenshots)
This figure is also helpful in describing the rationale:
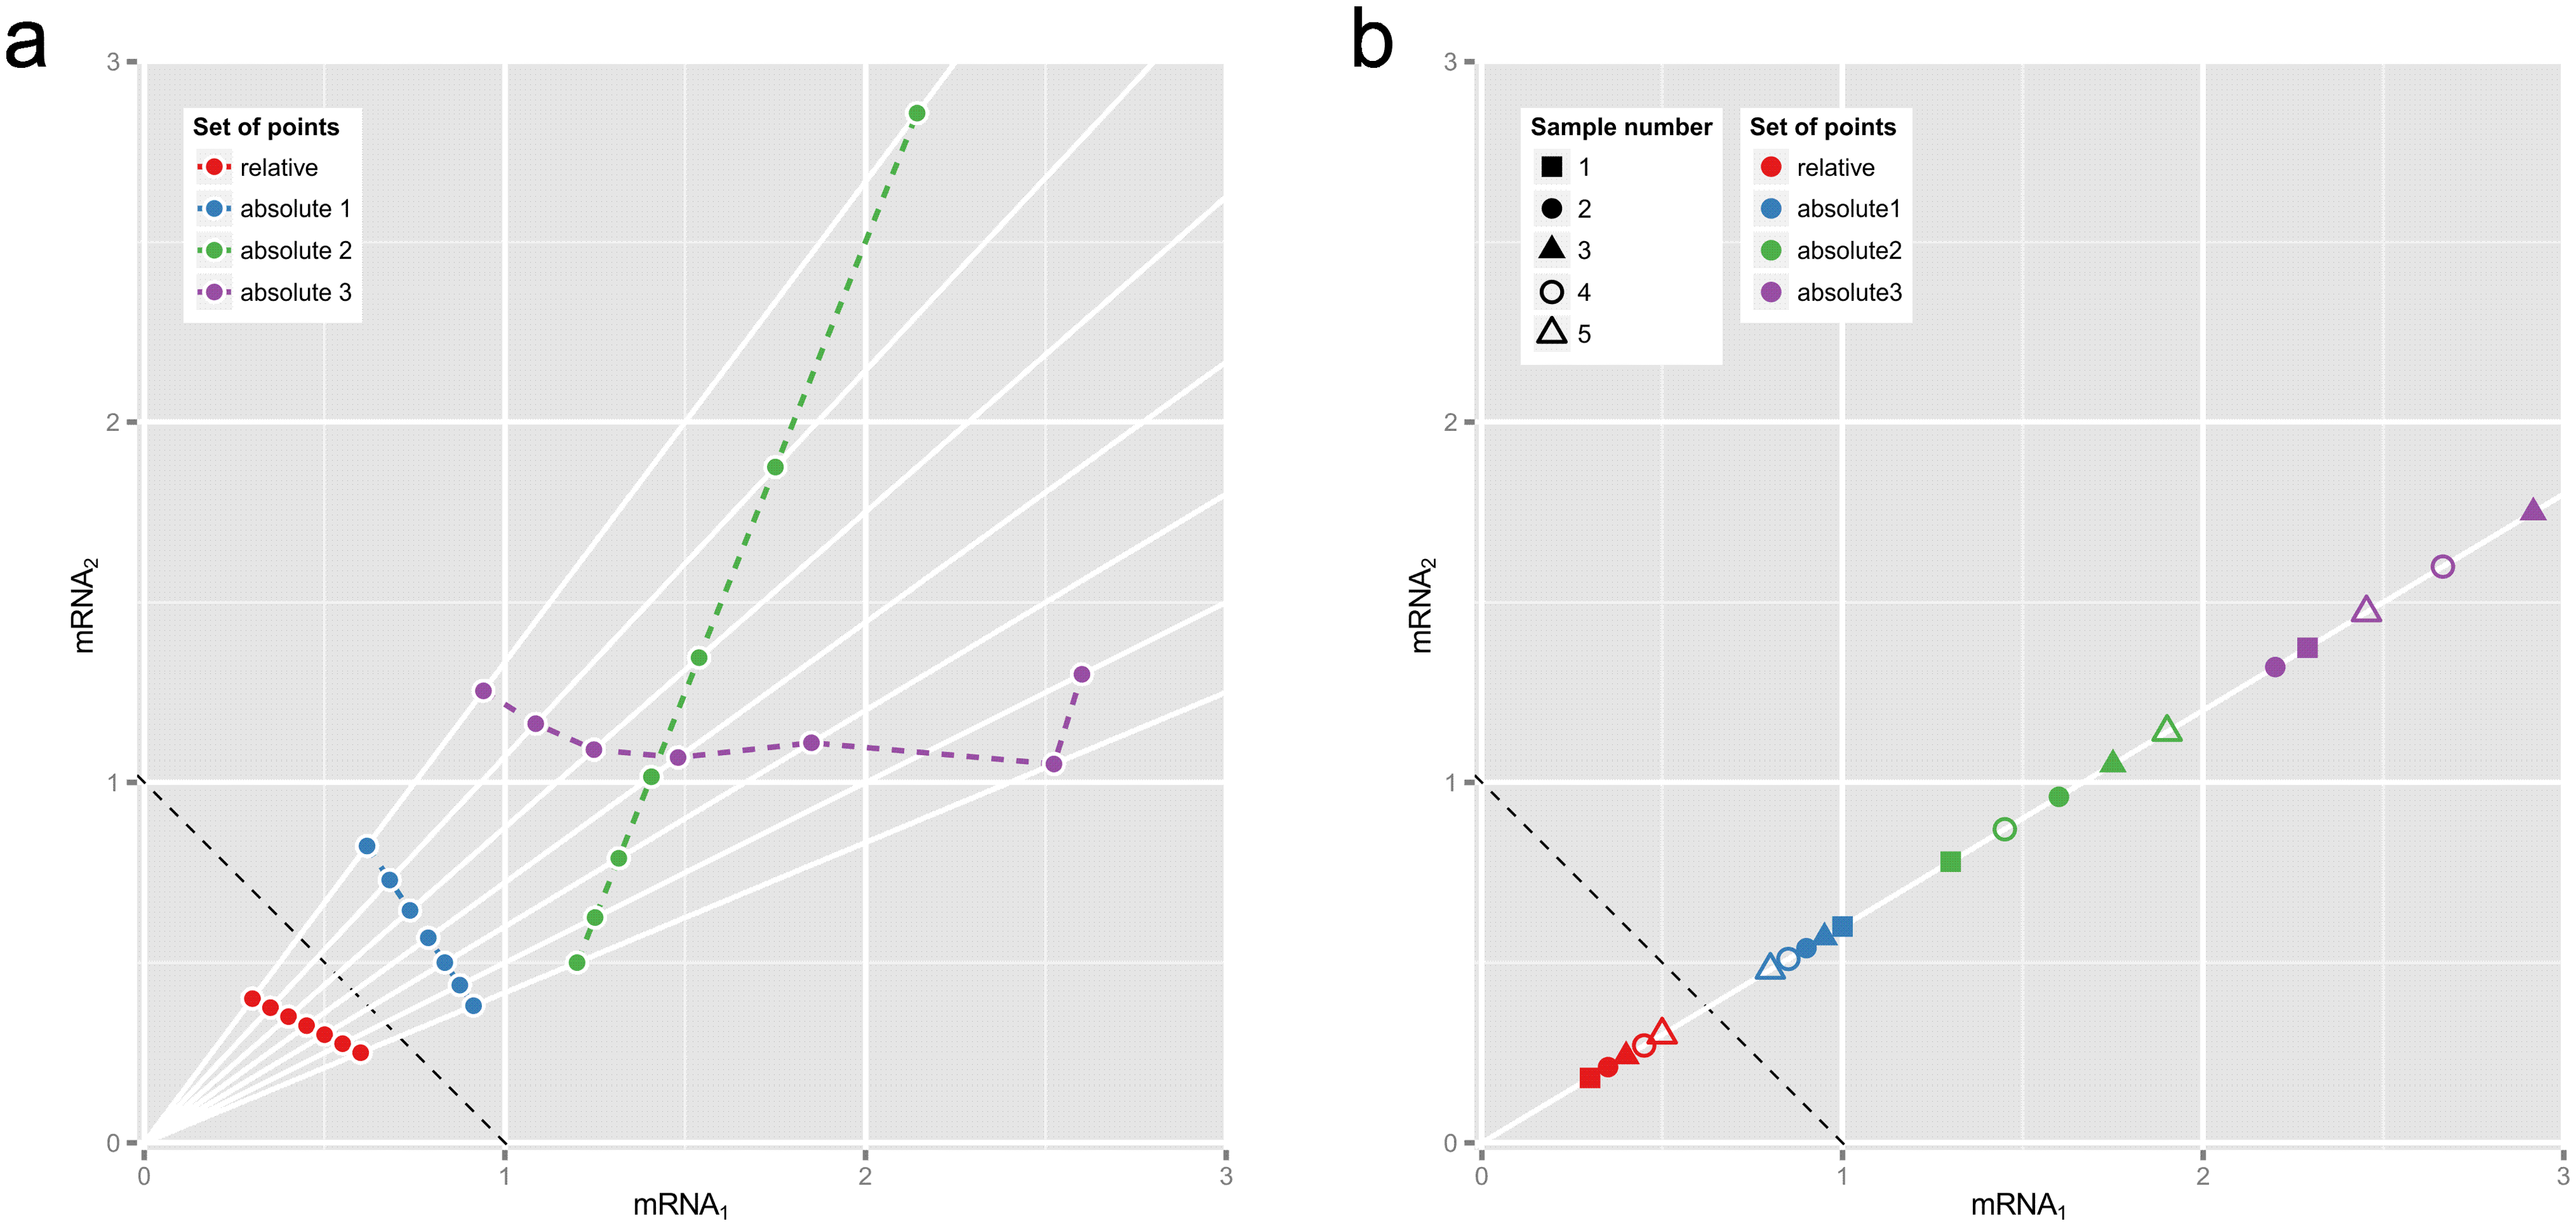
Fig 1. Why correlations between relative abundances tell us absolutely nothing. These plots show two hypothetical mRNAs that are part of a larger total. (a) Seven pairs of relative abundances (mRNA1/total, mRNA2/total) are shown in red, representing the two mRNAs in seven different experimental conditions. The dotted reference line shows (mRNA1 + mRNA2)/total = 1.) Rays from origin through the red points show absolute abundances that could have given rise to these relative abundances, e.g., the blue, green or purple sets of points (whose Pearson correlations are −1, +1 and 0.0 respectively). (b) Relative abundances that are proportional must come from equivalent absolute abundances. Here the blue, green or purple sets of point pairs have the same proportionality as the pairs of relative abundances in red, though not necessarily the same order or dispersion.
Key resources:
Issue Analytics
- State:

- Created 3 years ago
- Reactions:1
- Comments:8 (2 by maintainers)
 Top Related StackOverflow Question
 Troubleshoot Live Code
 Top Related Reddit Thread
 Top Related Hackernoon Post
 Top Related Tweet
 Top Related Dev.to Post
 Top Related Hashnode Post
I’ll add my two scents as a user:
Looks like a clean package but I don’t if some of the implementations are optimized. For example, the
clr_transformationuses an unnecessary for-loop. Check out my github.com/jolespin/compositional package when you get a chance. My plan is to get these implemented in scikit-bio (not as a dependency but a reimplementation). This package is just a placeholder until then.