question-mark
Stuck on an issue?

Lightrun Answers was designed to reduce the constant googling that comes with debugging 3rd party libraries. It collects links to all the places you might be looking at while hunting down a tough bug.

And, if you’re still stuck at the end, we’re happy to hop on a call to see how we can help out.

DPSS Multi-Tapering and STFT

See original GitHub issue

I tried to implement a standard multi-tapered short time fourier analysis only using functionality from scipy.signal and ran into problematic results.

Reproducing Code Example

import numpy as np                                                                        
from scipy.signal import windows, stft                                                    
from numpy.random import randn                                                            
                                                                                          
nSamples = 1000                                                                           
win_size = nSamples // 4                                                                  
# create a slepian sequence of 6 orthogonal tapers                                        
slepians = windows.dpss(win_size, NW=2, Kmax=6)                                           
signal = randn(nSamples)                                                                  
                                                                                          
# stft for each taper                                                                     
for order, taper in enumerate(slepians):                                                  
    freqs, times, pxx = stft(signal, window=taper, nperseg=win_size)     
    # the mean power over all windows                                            
    power_sum = np.abs(pxx).mean()   
    print(f'order {order}: {power_sum:e}')

This gives something like:

order 0: 6.270107e-02
order 1: 3.343302e+12
order 2: 1.013352e-01
order 3: 2.472677e+13
order 4: 2.233694e-01
order 5: 8.161814e+12

In multi-taper analysis one would now average along the different slepians to get a spectral estimate. However this clearly can’t work here as the odd slepians give a power spectral estimate >10orders of magnitude larger than the even ones. The reason for this is the built-in normalization of SciPy’s stft, which normalizes by the window norm. However, mathematically the odd Slepians fullfill win.sum() = 0, in practice it’s often more like win.sum() = 1e-13, hence SciPy’s normalization blows up the result. I ran some more in depth numerical tests and found some troubling instances where these number can become astronomical.

Suggestion

Maybe add a norm=None parameter to stft, right now a certain norm=spectralis anyways enforced internally in scipy.signal.spectral._spectral_helper(...).

Issue Analytics

  • State:open
  • Created 2 years ago
  • Comments:7 (3 by maintainers)

github_iconTop GitHub Comments

1reaction
tensionheadcommented, Oct 5, 2021

Update

Ok I now have a complete script which gets the correct normalizations for both types of scaling. The key lines are for normal windowed FFT analysis:

if scaling == 'spectrum':                                                                                             
    ampl_win = np.sqrt(2 * pxx_win)                                                                                   
elif scaling == 'density':                                                                                            
    ampl_win = np.sqrt(pxx_win * 3 * fs / nSamples)

The factor 3(!!) for the windowed FFT for scaling='density' is really weird, but as I see it it’s really needed to recover the amplitudes. Would be glad if you or someone could shine some light on this and/or check this again…

For multi-taper analysis:

  • first some pre-normalization of the slepians is needed:
if scaling == 'spectrum':
    slepians = slepians * np.sqrt(Kmax) / np.sqrt(nSamples)
  • we have to reverse the normalization after each FFT for the slepians here:
if scaling == 'spectrum':                                                                                         
    pxx = taper.sum()**2 * pxx 
  • finally we rescale the periodogram results to get the amplitudes:
if scaling == 'spectrum':                                                                                             
    ampl_slepian = np.sqrt(2 * pxx_slepian)                                                                           
elif scaling == 'density':                                                                                            
    ampl_slepian = np.sqrt(pxx_slepian * 2 * Kmax * fs / nSamples )

Note that for scaling='spectrum the slepians have to be normalized by hand, whereas for the other windows (for example ‘hann’ or ‘bartlett’) it works right away.

The results look fine now: DPSS norm-spectrum

DPSS norm-density

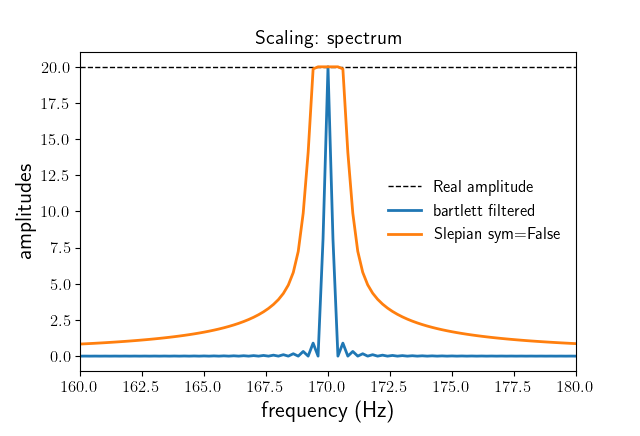
I attach the (zipped) script for brevity. mtm_norm_scipy.py.zip

Conclusion

I somehow find both options quite opaque, getting the right normalization involves quite some head scratching and educated guessing for both types of scaling:

  • scaling='density' needs a counter-intuitive factor (3(!!)) for normal windowed analysis, and a somewhat reasonable factor for the multi-taper analysis
  • scaling='spectrum' (default for signal.stft) needs more hands-on work (reversing the normalization) for the slepians, and might run into numerical precision problems if sym=True, which is the default for scipy.signal.dpss. But it’s more natural for the standard windowed FFT (plain periodogram).

I will take a step back now, and see if someone @SciPy with more intuition about Scipy’s inner workings might find a good solution? In any case the attached script shows it’s possible to get a correctly normalized multi-taper analysis, it’s just not really straighforward imho.

Edit: The initial problem of this issue (multi-taper short time fourier) can be addressed by using the oultined scaling='spectrum' approach, as signal.stft hardcodes this scaling (there is no scaling parameter for stft!) Setting sym=False as suggested by @dhruv9vats is the safer option to avoid numerical precision issues

0reactions
tensionheadcommented, Oct 5, 2021

Ok, that’s a lot of information to process here…

I agree that it doesn’t look too bad, most and foremost the sym=True/False for the slepians has apparently no effect anymore! I traced it to the spectral parameter scaling, which has the default of scaling='density' for both signal.periodogram and signal.welch, but scaling='spectrum' for signal.stft. Try to add scaling='spectrum' to your signal.welch(...) calls above, and you will see everything blows apart! With scaling='density' the quadratic norm of the window inside signall.spectral._spectral_helper() is taken, and hence the problematic sum-to-zero for the odd slepians disappears. So with this we found that the default behaviors of these scipy.signal spectral estimation methods differ, and that matters a lot for multi-taper analysis! Whereas the slepian sym parameter has no effect for scaling='density'.

Harmonic Amplitudes

I went the other way around, and build a little test-scenario with scaling='spectrum' as to be close to my initial issue with scipy.stft:

import numpy as np                                                                                                        
from scipy.signal import windows, periodogram                                                                             
                                                                                                                          
nSamples = 2500                                                                                                           
                                                                                                                          
# signal parameters                                                                                                       
fs = 1000 # 1000Hz sampling frequency                                                                                     
tvec = np.arange(0, nSamples) * 1 / fs                                                                                    
freq = 250 # Hz                                                                                                           
Ampl = 8                                                                                                                  
signal = Ampl * np.cos(2 * np.pi * freq * tvec)                                                                           
                                                                                                                          
# hann tapered power spectrum                                                                                             
freqs_hann, pxx_hann = periodogram(signal, fs=fs, window='hann', scaling='spectrum')                                      
                                                                                                                          
# amplitude spectrum -> pxx gives Ampl**2 / 2                                                                             
ampl_hann = np.sqrt(2 * pxx_hann)                                                                                         
                                                                                                                          
print(f'Real amplitude: {Ampl}, Hann peak: {ampl_hann.max()}')                                                            
                                                                                                                          
# create a slepian sequence of 6 orthogonal tapers                                                                        
Kmax = 6                                                                                                                  
sym = False   # change to True if needed                                                                                                            
slepians = windows.dpss(nSamples, NW=2, Kmax=Kmax, sym=sym)                                                               
                                                                                                                          
# -- uncomment this line for normalization! --                                                                           
# slepians = slepians * np.sqrt(Kmax) / np.sqrt(nSamples)                                                                 
# ---                                                                                                                     
                                                                                                                          
pxx_seq = []                                                                                                              
# fft for each taper                                                                                                      
for order, taper in enumerate(slepians):                                                                                  
    freqs, pxx = periodogram(signal, fs=fs, window=taper, scaling='spectrum')                                             
                                                                                                                          
    # -- uncomment this line for normalization! --                                                                       
    # pxx = taper.sum()**2 * pxx                                                                                          
    # ---                                                                                                                 
                                                                                                                          
    pxx_seq.append(pxx)                                                                                                   
                                                                                                                          
# average tapers                                                                                                          
pxx_slepian = np.mean(pxx_seq, axis=0)                                                                                    
ampl_slepian = np.sqrt(2 * pxx_slepian)                                                                                   
                                                                                                                          
print(f'Real amplitude: {Ampl}, MTM peak: {ampl_slepian.max()}') 

This gives me:

Real amplitude: 8, Hann peak: 8.0
Real amplitude: 8, MTM peak: 35292.08524782706

So by using a plain Hann window I can recover the harmonic amplitude of the test signal, whereas for the slepians neither sym=True nor sym=False give the correct result (but they still differ!!). Moreover, when you zoom into the power spectrum you see a wrong double peak, as the normalization bites us:

DPSS norm

I actually now found a way to get a correct normalization (via reversing scipy’s and a little educated guessing), with the two commented lines in the script above I can get it to work 😃

Discussion

So what to make of it all? I will see that I get a correct normalization working (recovering the harmonic amplitude) with scaling='density'. If that works nicely, than at least the default scaling should be the same for all scipy.signal methods?!

Right now out-of-the box multi-taper analysis with stft is definitely broken, as it is for the other methods with scaling='spectrum'. The cleanest solution imho would still be to have an option to turn off automatic normalization for expert users (scaling=None), so they can take care about normalization themselves.

Read more comments on GitHub >

github_iconTop Results From Across the Web

Multitaper - YouTube
The final time-frequency analysis method shown here is the multitaper method. It is an extention of the STFFT that can be useful in...
Read more >
Task-Oriented Comparison of Power Spectral Density ... - NCBI
The power spectral density as estimated using the short-time Fourier transform (STFT), Welch's periodogram, and Thomson's multitaper technique, ...
Read more >
Spectral Analysis for Signal Detection and Classification ...
introduce the short-time Fourier transform of a signal ... Gaussian noise, (a) the Thomson multitaper method, DPSS obtained according to Eq. (71).
Read more >
scipy.signal.windows.dpss — SciPy v1.9.3 Manual
Compute the Discrete Prolate Spheroidal Sequences (DPSS). DPSS (or Slepian sequences) are often used in multitaper power spectral density estimation (see [1]).
Read more >
Why so many methods of computing PSD?
PSD using multitaper method (MTM); PSD using Welch's method; PSD using Yule-Walker AR method; Spectrogram using short-time Fourier transform ...
Read more >

github_iconTop Related Medium Post

No results found

github_iconTop Related StackOverflow Question

No results found

github_iconTroubleshoot Live Code

Lightrun enables developers to add logs, metrics and snapshots to live code - no restarts or redeploys required.
Start Free

github_iconTop Related Reddit Thread

No results found

github_iconTop Related Hackernoon Post

No results found

github_iconTop Related Tweet

No results found

github_iconTop Related Dev.to Post

No results found

github_iconTop Related Hashnode Post

No results found