
Lightrun Answers was designed to reduce the constant googling that comes with debugging 3rd party libraries. It collects links to all the places you might be looking at while hunting down a tough bug.
And, if you’re still stuck at the end, we’re happy to hop on a call to see how we can help out.
Interpolation 2D with SmoothBivariateSpline
See original GitHub issueI get some strange results when using SmoothBivariateSpline.
I may use it in a wrong way (there is no example in a doc), so I’ve created simple example to reproduce my problem. Using known recipe for a 2d surface, I sample it and try to interpolate. To make it simple I use regularly spaced grid of points although the Spline is said to allow to use non-regular grid.
import matplotlib.pyplot as plt
import numpy as np
import scipy.interpolate

train_x, train_y = np.meshgrid(np.arange(-5, 5, 0.5), np.arange(-5, 5, 0.5))
train_x = train_x.flatten()
train_y = train_y.flatten()
z_func = lambda x, y: np.cos(x) + np.sin(y) ** 2

train_z = z_func(train_x, train_y)
interp_func = scipy.interpolate.SmoothBivariateSpline(train_x, train_y, train_z)

test_x = np.arange(-10, 10, 0.01)
test_y = np.arange(-10, 10, 0.01)
grid_x, grid_y = np.meshgrid(test_x, test_y)

interp_result = interp_func(test_x, test_y)
perfect_result = z_func(grid_x, grid_y)

fig, axes = plt.subplots(1, 2, figsize=(12, 8))
extent = [test_x[0], test_x[-1], test_y[0], test_y[-1]]
axes[0].imshow(perfect_result, aspect='auto', cmap='nipy_spectral', extent=extent)
axes[0].plot(train_x, train_y, 'w.')
axes[0].set_title('Perfect result, sampled function')
axes[1].imshow(interp_result, aspect='auto', cmap='nipy_spectral', extent=extent)
axes[1].plot(train_x, train_y, 'w.')
axes[0].set_title('SmoothBivariateSpline')
plt.show()
The result is somewhat strange:
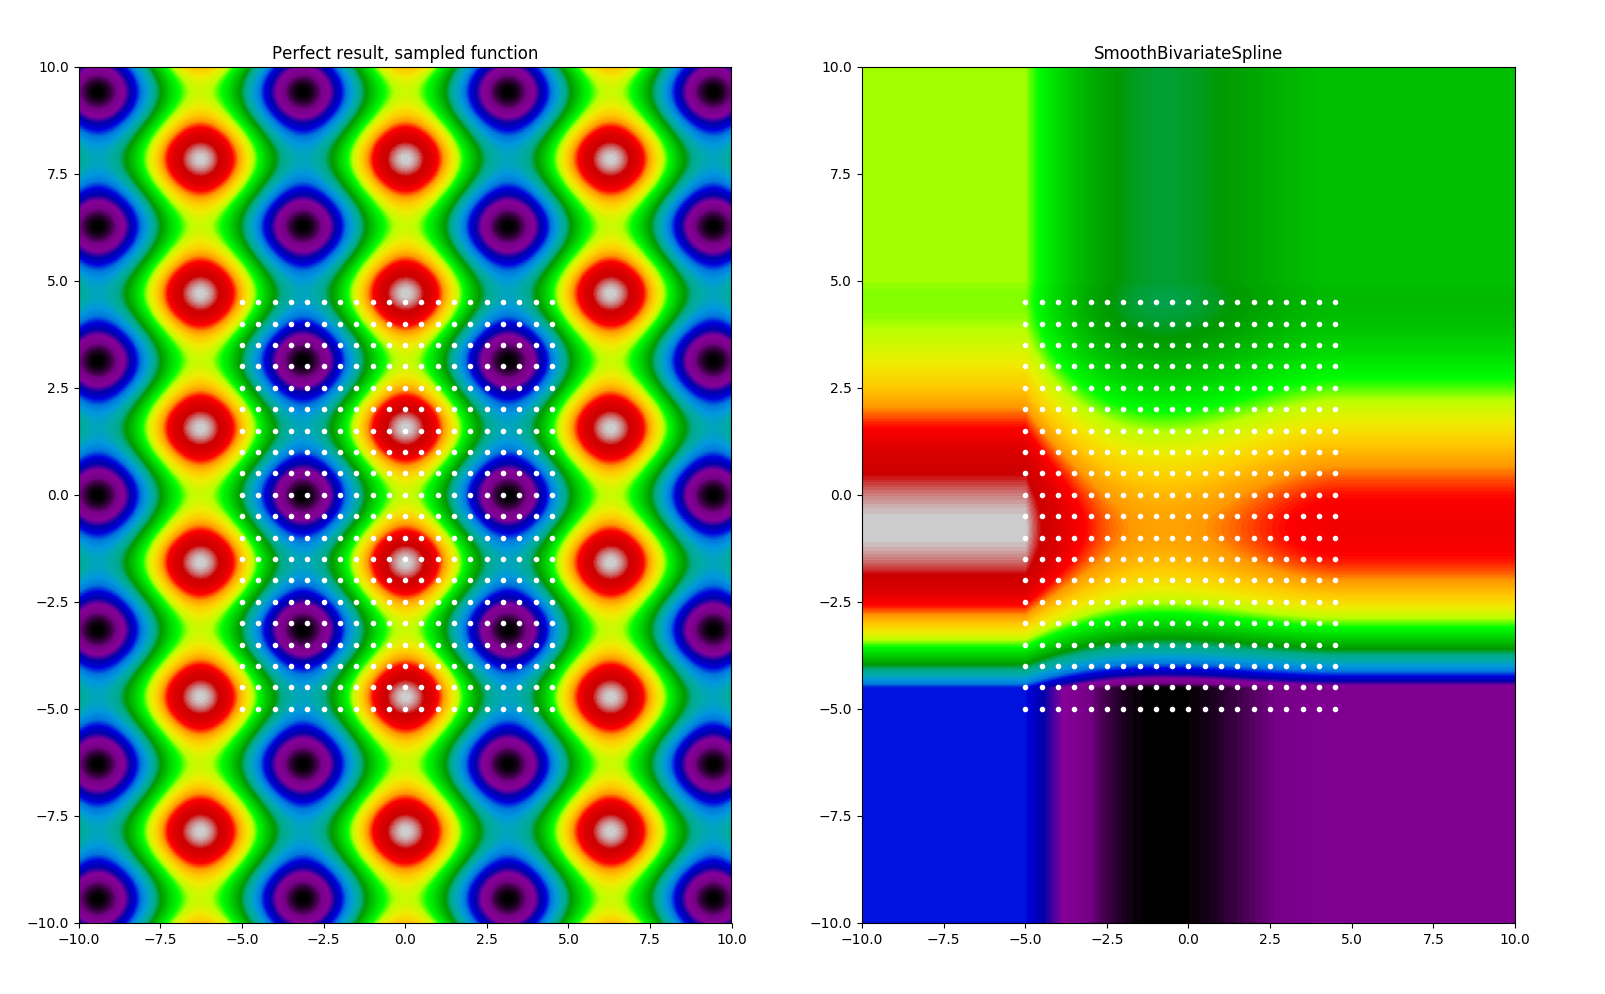
Right image should be similar to left image in the middle area, where I’ve provided sample points of the surface.
Do I have some error? Or is there a bug? Or maybe you know of some other ways of interpolating using non-regularly spaced points?
Issue Analytics
- State:

- Created 3 years ago
- Comments:5 (4 by maintainers)
 Top Related StackOverflow Question
 Troubleshoot Live Code
 Top Related Reddit Thread
 Top Related Hackernoon Post
 Top Related Tweet
 Top Related Dev.to Post
 Top Related Hashnode Post
This example is now a part of the tutorial, merged as a part of gh-16707. Thanks @dankal444 !
This example is now included into gh-16707. Thank you @dankal444 ! A review of gh-16707 from a user perspective would be much appreciated BTW.