
Lightrun Answers was designed to reduce the constant googling that comes with debugging 3rd party libraries. It collects links to all the places you might be looking at while hunting down a tough bug.
And, if you’re still stuck at the end, we’re happy to hop on a call to see how we can help out.
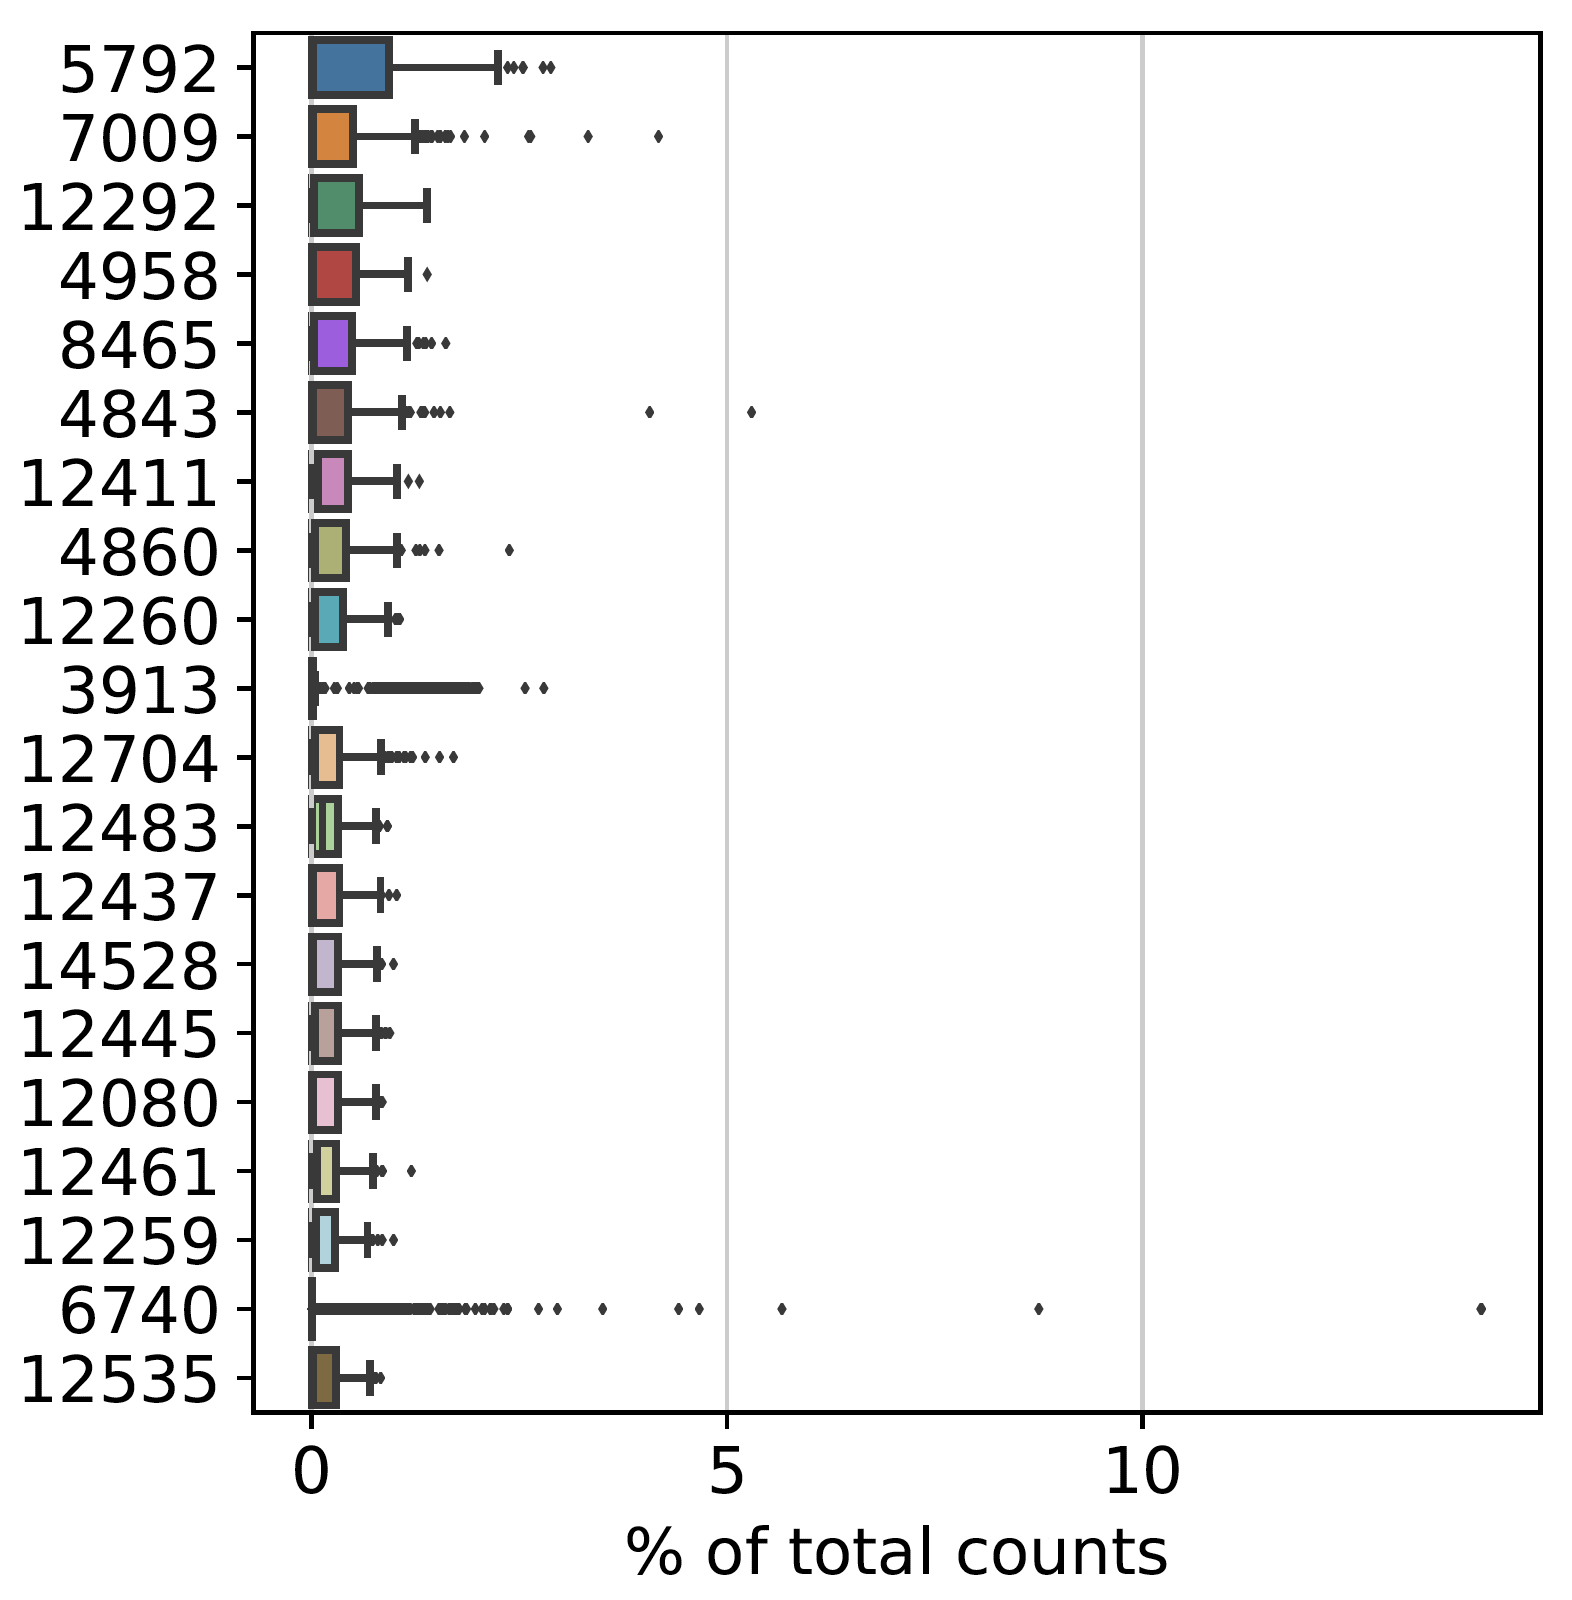
Gene Names/Identities are showing up as numbers when plotted with highest_expr_genes()
See original GitHub issueWhen processing the data in Scanpy I am unable to figure out why my plot of the Highest Expressed Genes shows up with numbers rather than gene names as the identifiers on the Y-axis.
Example:
I am worried that it may not be reading our file properly, but even when I converted from a txt file to a .loom file I still got the same problem. I am unsure if this is an issue with our original input or if something it is being read improperly. I will include some of my code below, and if there is somewhere you would like me to send copies of raw data to run it on let me know where to send it.
I am using the tutorial for Clustering on the Scanpy website as the basis for my code.
sc.settings.set_figure_params(dpi = 80)

day00a = sc.read_text("/alex_ryan/D0.1500.dge", first_column_names = True, delimiter = "\t")
day01 = sc.read_text("/alex_ryan/D1.txt.500.dge", first_column_names = True, delimiter = "\t")
day02 = sc.read_text("/alex_ryan/D2.txt.500.dge", first_column_names = True, delimiter = "\t")
day04 = sc.read_text("/alex_ryan/D4.txt.500.dge", first_column_names = True, delimiter = "\t")
day09 = sc.read_text("/alex_ryan/D9.txt.500.dge", first_column_names = True, delimiter = "\t")
day11 = sc.read_text("/alex_ryan/D11.txt.500.dge", first_column_names = True, delimiter = "\t")

day00a.obs['tech'] = 'Day 0'
day01.obs['tech'] = 'Day 1'
day02.obs['tech'] = 'Day 2'
day04.obs['tech'] = 'Day 4'
day09.obs['tech'] = 'Day 9'
day11.obs['tech'] = 'Day 11'

adata_list = [day01, day02, day04, day09, day11]
adata2 = day00a.concatenate(adata_list, join = 'outer')
adata = adata2

sc.pl.highest_expr_genes(adata, n_top = 20, save = True)
I am adding the extra .obs ‘tech’ tag so that I can identify the cells by day after they have been combined into one anndata object. I don’t think this is causing the issue, but if that is part of it, then please let me know if there is a work around.
Issue Analytics
- State:

- Created 4 years ago
- Comments:10 (4 by maintainers)
 Top Related StackOverflow Question
 Troubleshoot Live Code
 Top Related Reddit Thread
 Top Related Hackernoon Post
 Top Related Tweet
 Top Related Dev.to Post
 Top Related Hashnode Post
@ivirshup @LuckyMD I fixed the problem - the issue was in the original h5ad file converted from a Seurat object using SeuratDisk::Convert(). It seems the var data wasn’t ported over properly for the assay I was using. I rebuilt the h5ad file using reticulate instead and that solved the problem.
I have encountered the same issue as @mosquitoCat . Although adata.var_names still returns correct gene symbols, all my name IDs become numbers: for example, sc.pl.umap(adata,color=‘GeneName’) will return errors. but sc.pl.umap(adata,color=‘123’) can be recognized. SeuratDisk::Convert() seems to cause some trouble here. Is there a way to fix it? @ivirshup