
Lightrun Answers was designed to reduce the constant googling that comes with debugging 3rd party libraries. It collects links to all the places you might be looking at while hunting down a tough bug.
And, if you’re still stuck at the end, we’re happy to hop on a call to see how we can help out.
Url with "=" causes Sitespeed container to crash or not report to Grafana
See original GitHub issueSetup: Use the docker compose file to run Sitespeed + Grafana per https://www.sitespeed.io/documentation/sitespeed.io/performance-dashboard/#docker-compose-file Windows 10 (build 15063.674)
Good case: “/research” Data appears in Grafana for the “/research” url. Everything works great (sitespeed/WPT files written to dish, Grafana dashboards are populated with Sitespeed and WPT data)
docker-compose run sitespeed.io https://www.payscale.com/research --graphite.host=graphite --webpagetest.key WPT_KEY_HERE --webpagetest.runs 1 --video --speedIndex --firstParty ".*payscale.*"
Bad case 1: “/research/US/Job=Registered_Nurse_(RN)/Hourly_Rate” Expected: Grafana contains data Actual: Sitespeed container crashes at ffprobe Params are identical to the good case above and only the url is different WPT screenshots and movies are written to disk Sitespeed files are NOT written to disk.
docker-compose run sitespeed.io https://www.payscale.com/research/US/Job=Registered_Nurse_(RN)/Hourly_Rate --graphite.host=graphite --webpagetest.key WPT_KEY_HERE --webpagetest.runs 1 --video --speedIndex --firstParty ".*payscale.*"
Google Chrome 60.0.3112.78
Mozilla Firefox 54.0
[2017-11-16 18:49:15] INFO: Versions OS: linux 4.9.49-moby nodejs: v6.11.1 sitespeed.io: 5.6.5 browsertime: 1.9.4 coach: 0.36.0
[2017-11-16 18:49:16] INFO: Sending url https://www.payscale.com/research/US/Job=Registered_Nurse_(RN)/Hourly_Rate to test on https://www.webpagetest.org
[2017-11-16 18:49:16] INFO: Starting chrome for analysing https://www.payscale.com/research/US/Job=Registered_Nurse_(RN)/Hourly_Rate 3 time(s)
[2017-11-16 18:49:16] INFO: Testing url https://www.payscale.com/research/US/Job=Registered_Nurse_(RN)/Hourly_Rate run 1
[2017-11-16 18:49:36] INFO: Got https://www.payscale.com/research/US/Job=Registered_Nurse_(RN)/Hourly_Rate analysed with id 171116_72_bd69254d42bcbd0106f46304a32936c9 from https://www.webpagetest.org
[2017-11-16 18:49:39] ERROR: Error: Command failed: ffprobe -f lavfi -i movie='/sitespeed.io/sitespeed-result/www.payscale.com/2017-11-16-18-49-15/pages/www.payscale.com/research/US/Job=Registered_Nurse_(RN)/Hourly_Rate/data/video/0.mp4',signalstats -show_entries frame_tags=lavfi.signalstats.SATAVG -v quiet -print_format json
{

}

    at Promise.all.then.arr (/usr/src/app/node_modules/execa/index.js:208:11)
    at process._tickCallback (internal/process/next_tick.js:109:7)
From previous event:
    at Promise.resolve.tap.tap.tap.tap.tap.tap.tap.tap.tap.tap.results (/usr/src/app/node_modules/browsertime/lib/core/engine.js:363:19)
From previous event:
    at runIteration (/usr/src/app/node_modules/browsertime/lib/core/engine.js:362:10)
    at Promise.reduce (/usr/src/app/node_modules/browsertime/lib/core/engine.js:409:27)
From previous event:
    at Promise.resolve.tap.tap.tap.tap.result (/usr/src/app/node_modules/browsertime/lib/core/engine.js:406:17)
    at runCallback (timers.js:672:20)
    at tryOnImmediate (timers.js:645:5)
    at processImmediate [as _immediateCallback] (timers.js:617:5)
From previous event:
    at Engine.run (/usr/src/app/node_modules/browsertime/lib/core/engine.js:405:8)
    at engine.start.then (/usr/src/app/lib/plugins/browsertime/analyzer.js:95:26)
From previous event:
    at Object.analyzeUrl (/usr/src/app/lib/plugins/browsertime/analyzer.js:95:8)
    at storageManager.createDirForUrl.then.then (/usr/src/app/lib/plugins/browsertime/index.js:173:32)
    at /usr/src/app/node_modules/mkdirp/index.js:30:20
    at FSReqWrap.oncomplete (fs.js:123:15)
From previous event:
    at Object.processMessage (/usr/src/app/lib/plugins/browsertime/index.js:173:12)
    at queue.process.message (/usr/src/app/lib/support/queueHandler.js:192:32)
    at drainItem (/usr/src/app/node_modules/concurrent-queue/index.js:96:21)
    at Immediate.drain (/usr/src/app/node_modules/concurrent-queue/index.js:77:84)
    at runCallback (timers.js:672:20)
    at tryOnImmediate (timers.js:645:5)
    at processImmediate [as _immediateCallback] (timers.js:617:5)
[2017-11-16 18:49:40] ERROR: TypeError: /usr/src/app/lib/plugins/html/templates/pages.pug:16
    14|       +numberCell('Requests', p.requests)
    15|       if options.speedIndex
  > 16|         +numberCell('First Visual Change', b.visualMetrics[0].FirstVisualChange)
    17|         +numberCell('Speed Index', b.visualMetrics[0].SpeedIndex)
    18|         +numberCell('Last Visual Change', b.visualMetrics[0].LastVisualChange)
    19|       else

Cannot read property '0' of undefined
    at Object.eval (eval at wrap (/usr/src/app/node_modules/pug-runtime/wrap.js:6:10), <anonymous>:188:64)
    at Object.pug_interp [as rows] (eval at wrap (/usr/src/app/node_modules/pug-runtime/wrap.js:6:10), <anonymous>:235:4)
    at eval (eval at wrap (/usr/src/app/node_modules/pug-runtime/wrap.js:6:10), <anonymous>:387:19)
    at template (eval at wrap (/usr/src/app/node_modules/pug-runtime/wrap.js:6:10), <anonymous>:420:184)
    at Object.renderTemplate (/usr/src/app/lib/plugins/html/renderer.js:27:37)
    at HTMLBuilder._renderSummaryPage (/usr/src/app/lib/plugins/html/htmlBuilder.js:288:16)
    at Object.keys.map.name (/usr/src/app/lib/plugins/html/htmlBuilder.js:124:12)
    at Array.map (native)
    at HTMLBuilder.render (/usr/src/app/lib/plugins/html/htmlBuilder.js:123:54)
    at Object.close (/usr/src/app/lib/plugins/html/index.js:21:29)
    at Promise.resolve.filter.map.plugin (/usr/src/app/lib/sitespeed.js:45:47)
From previous event:
    at runOptionalFunction (/usr/src/app/lib/sitespeed.js:45:6)
    at runOptionalFunction.then.then.tap.errors (/usr/src/app/lib/sitespeed.js:152:15)
From previous event:
    at loader.loadPlugins.then.plugins (/usr/src/app/lib/sitespeed.js:151:14)
    at runCallback (timers.js:672:20)
    at tryOnImmediate (timers.js:645:5)
    at processImmediate [as _immediateCallback] (timers.js:617:5)
From previous event:
    at storageManager.createDataDir.then.then.then.then.then.pluginNames (/usr/src/app/lib/sitespeed.js:129:48)
From previous event:
    at Object.run (/usr/src/app/lib/sitespeed.js:128:8)
    at Object.<anonymous> (/usr/src/app/bin/sitespeed.js:30:4)
    at Module._compile (module.js:570:32)
    at Object.Module._extensions..js (module.js:579:10)
    at Module.load (module.js:487:32)
    at tryModuleLoad (module.js:446:12)
    at Function.Module._load (module.js:438:3)
    at Module.runMain (module.js:604:10)
    at run (bootstrap_node.js:389:7)
    at startup (bootstrap_node.js:149:9)
    at bootstrap_node.js:504:3
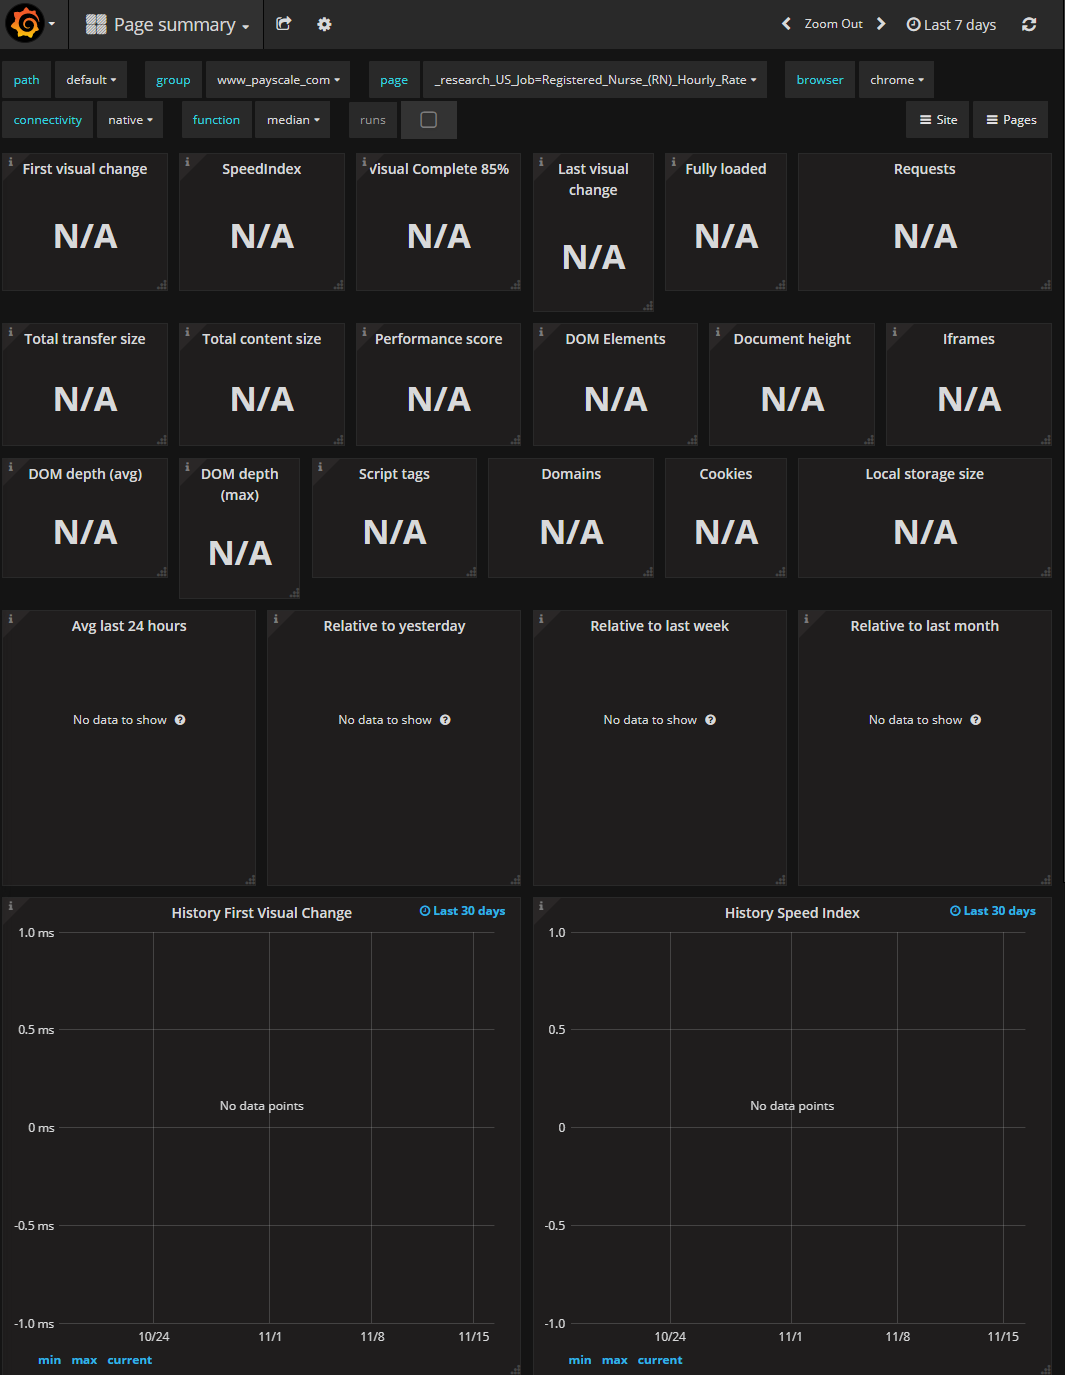
Bad case 2: “/research/US/Job=Registered_Nurse_(RN)/Hourly_Rate” Expected: Grafana contains data Actual: No data (everything is N/A or empty) but the Grafana “page” dropdown contains an entry for the url Sitespeed/WPT files are still written to disk.
C:\docker>docker-compose run sitespeed.io https://www.payscale.com/research/US/Job=Registered_Nurse_(RN)/Hourly_Rate --graphite.host=graphite --webpagetest.key WPT_KEY_HERE --webpagetest.runs 1 --speedIndex
    Google Chrome 60.0.3112.78
    Mozilla Firefox 54.0
    [2017-11-16 18:40:20] INFO: Versions OS: linux 4.9.49-moby nodejs: v6.11.1 sitespeed.io: 5.6.5 browsertime: 1.9.4 coach: 0.36.0
    [2017-11-16 18:40:20] INFO: Sending url https://www.payscale.com/research/US/Job=Registered_Nurse_(RN)/Hourly_Rate to test on https://www.webpagetest.org
    [2017-11-16 18:40:20] INFO: Starting chrome for analysing https://www.payscale.com/research/US/Job=Registered_Nurse_(RN)/Hourly_Rate 3 time(s)
    [2017-11-16 18:40:20] INFO: Testing url https://www.payscale.com/research/US/Job=Registered_Nurse_(RN)/Hourly_Rate run 1
    [2017-11-16 18:40:37] INFO: Testing url https://www.payscale.com/research/US/Job=Registered_Nurse_(RN)/Hourly_Rate run 2
    [2017-11-16 18:40:41] INFO: Got https://www.payscale.com/research/US/Job=Registered_Nurse_(RN)/Hourly_Rate analysed with id 171116_Q1_84e82c382be5f41fbb1f76c11916fced from https://www.webpagetest.org
    [2017-11-16 18:41:14] INFO: Testing url https://www.payscale.com/research/US/Job=Registered_Nurse_(RN)/Hourly_Rate run 3
    [2017-11-16 18:41:35] INFO: 272 requests, 1590.27 kb, backEndTime: 317ms (±14.38ms), firstPaint: 1.10s (±18.19ms), firstVisualChange: 400ms (±13.68ms), DOMContentLoaded: 2.23s (±124.54ms), Load: 10.98s (±2.31s), speedIndex: 2104 (±170.52), visualComplete85: 2.16s (±109.96ms), lastVisualChange: 11.54s (±2.49s), rumSpeedIndex: 1435 (±100.60) (3 runs)
    [2017-11-16 18:41:40] INFO: HTML stored in /sitespeed.io/sitespeed-result/www.payscale.com/2017-11-16-18-40-20
    [2017-11-16 18:41:40] INFO: Finished analysing https://www.payscale.com/research/US/Job=Registered_Nurse_(RN)/Hourly_Rate
Files written to C:\docker\sitespeed-result\www.payscale.com for the cases above bad-case-1-2017-11-16-18-49-15.zip bad-case-2-2017-11-16-18-40-20.zip good-case-2017-11-16-17-59-57.zip
And the Grafana dashboard for the bad cases
Issue Analytics
- State:

- Created 6 years ago
- Comments:14 (10 by maintainers)
 Top Related StackOverflow Question
 Troubleshoot Live Code
 Top Related Reddit Thread
 Top Related Hackernoon Post
 Top Related Tweet
 Top Related Dev.to Post
 Top Related Hashnode Post
@orjan pushed the release now. 6.2.0, it will be available in a couple of minutes.
@orjan the fix is in master, will release it late tonight or early tomorrow.