
Lightrun Answers was designed to reduce the constant googling that comes with debugging 3rd party libraries. It collects links to all the places you might be looking at while hunting down a tough bug.
And, if you’re still stuck at the end, we’re happy to hop on a call to see how we can help out.
[BUG] plot_series inconsistent date/time index
See original GitHub issueDescribe the bug
To Reproduce
y = load_airline()
y = y[:48]
fh=np.arange(1, 13)
y_train, y_test = temporal_train_test_split(y, test_size=len(fh))
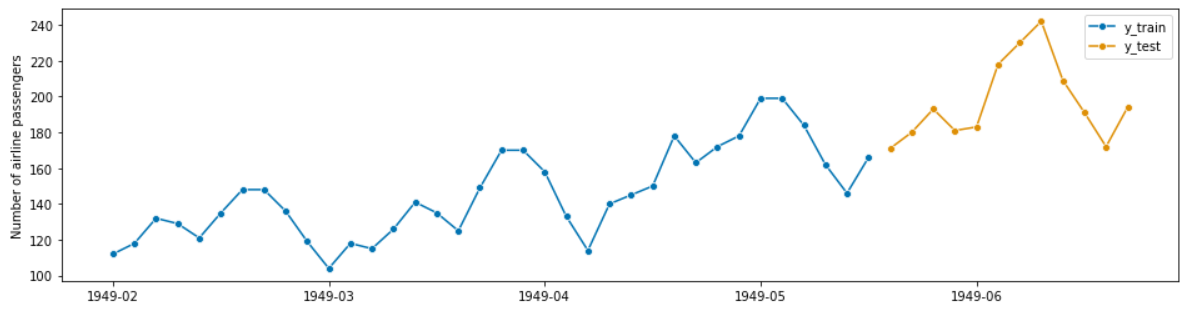
plot_series(y_train, y_test, labels=["y_train", "y_test"]);
print(y.shape, y_train.shape[0], y_test.shape[0])
print(y.index)
(48,) 36 12 PeriodIndex([‘1949-01’, ‘1949-02’, ‘1949-03’, ‘1949-04’, ‘1949-05’, ‘1949-06’, ‘1949-07’, ‘1949-08’, ‘1949-09’, ‘1949-10’, ‘1949-11’, ‘1949-12’, ‘1950-01’, ‘1950-02’, ‘1950-03’, ‘1950-04’, ‘1950-05’, ‘1950-06’, ‘1950-07’, ‘1950-08’, ‘1950-09’, ‘1950-10’, ‘1950-11’, ‘1950-12’, ‘1951-01’, ‘1951-02’, ‘1951-03’, ‘1951-04’, ‘1951-05’, ‘1951-06’, ‘1951-07’, ‘1951-08’, ‘1951-09’, ‘1951-10’, ‘1951-11’, ‘1951-12’, ‘1952-01’, ‘1952-02’, ‘1952-03’, ‘1952-04’, ‘1952-05’, ‘1952-06’, ‘1952-07’, ‘1952-08’, ‘1952-09’, ‘1952-10’, ‘1952-11’, ‘1952-12’], dtype=‘period[M]’, name=‘Period’, freq=‘M’)
Expected behavior The X-axis should go till end of 1952. The X-axis on the plot does not reflect the indices correctly. It should go till 1952, but shows values only till 1949
Versions System: python: 3.6.12 |Anaconda, Inc.| (default, Sep 9 2020, 00:29:25) [MSC v.1916 64 bit (AMD64)] executable: C:\Users\xxxx\AppData\Local\Continuum\anaconda3\envs\sktime\python.exe machine: Windows-10-10.0.18362-SP0
Python dependencies: pip: 20.3 setuptools: 49.6.0 sklearn: 0.23.2 numpy: 1.19.2 scipy: 1.5.2 Cython: 0.29.17 pandas: 1.1.3 matplotlib: 3.3.2 joblib: 0.17.0 numba: None pmdarima: 1.7.1 tsfresh: None
Issue Analytics
- State:

- Created 3 years ago
- Comments:10 (1 by maintainers)
 Top Related StackOverflow Question
 Troubleshoot Live Code
 Top Related Reddit Thread
 Top Related Hackernoon Post
 Top Related Tweet
 Top Related Dev.to Post
 Top Related Hashnode Post
If you’re interested in looking into this, I’d appreciate a PR!
I can try to fix this!