
Lightrun Answers was designed to reduce the constant googling that comes with debugging 3rd party libraries. It collects links to all the places you might be looking at while hunting down a tough bug.
And, if you’re still stuck at the end, we’re happy to hop on a call to see how we can help out.
[ENH] Plotting confidence intervals
See original GitHub issueIs your feature request related to a problem? Please describe.
Plotting confidence intervalls with the current plot function from sktime.utils.plotting import plot_series is not well suitable in case all lines are very close, see picture.
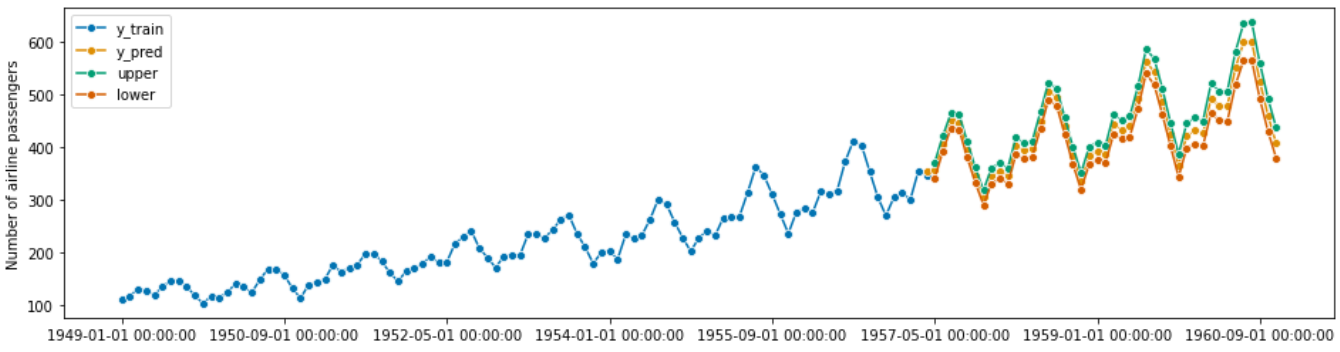
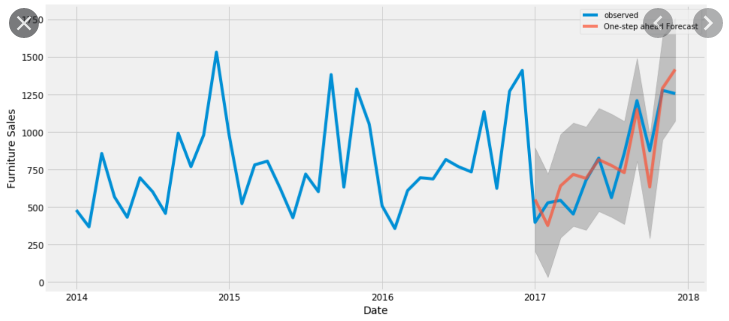
Describe the solution you’d like
Plot like this would be great, with the points as an option ideally. The function could just receive the DataFrame pred_int from y_pred, pred_int = model.predict(fh=fh, return_pred_int=True) as an input so this is already well structured and named.
Issue Analytics
- State:

- Created 3 years ago
- Reactions:4
- Comments:17
 Top Related StackOverflow Question
 Troubleshoot Live Code
 Top Related Reddit Thread
 Top Related Hackernoon Post
 Top Related Tweet
 Top Related Dev.to Post
 Top Related Hashnode Post
I’d love to take this on!
@aiexplorations
alpha = [0.95, 0.9, 0.5]and loop 3 times over_fit()andpredict().predict()is returning apd.Seriesand nopd.DataFrame. A better solution could be to return the prediction also when doingpredict(return_pred_int=True). Or you can just merge the results ofpredict()andpredict(return_pred_int=True)?@fkiraly thanks for mentioning, I think for now I will rather continue with contributing to
sktime😃