
Lightrun Answers was designed to reduce the constant googling that comes with debugging 3rd party libraries. It collects links to all the places you might be looking at while hunting down a tough bug.
And, if you’re still stuck at the end, we’re happy to hop on a call to see how we can help out.
GLobal/Panel Forecasting Using Decision Trees/Decision Tree Ensembles
See original GitHub issueIs your feature request related to a problem? Please describe. With reference to #1074
Given a dataset in Panel format, for .e.g
| Time | Store Id | Sales |
|---|---|---|
| Jan | Store1 | 283 |
| … | Store1 | … |
| Dec | Store1 | 200 |
| Jan | Store2 | 11 |
| … | Store2 | … |
| Dec | Store2 | 31 |
We need a make_panel_reduction with exogenous variables which transforms the data into the following format.
The IDs identifying multiple panels will be passed as Categorical Exogenous Variable.
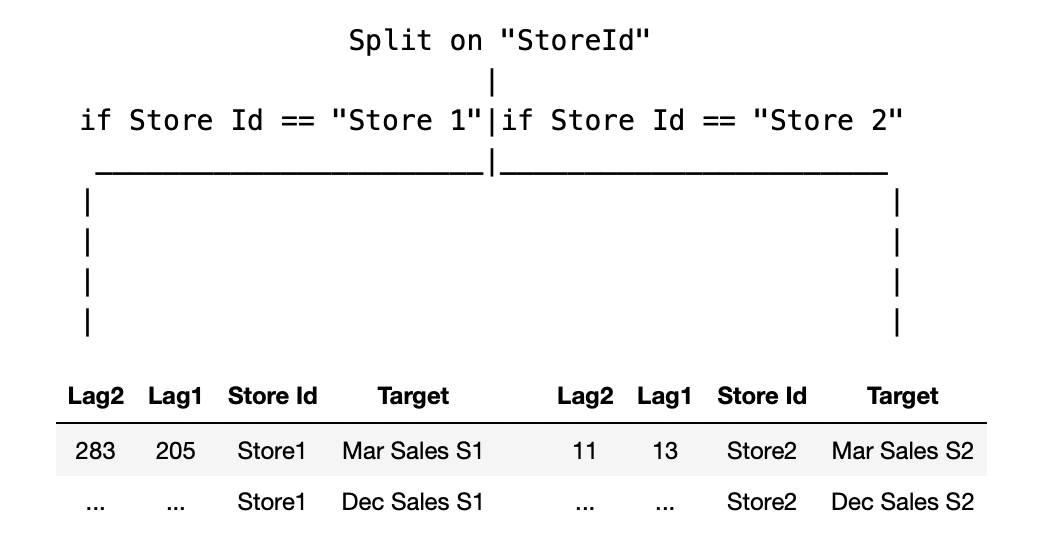
| Lag2 | Lag1 | Store Id | Target |
|---|---|---|---|
| 283 | 205 | Store1 | Mar Sales S1 |
| … | … | Store1 | Dec Sales S1 |
| 11 | 13 | Store2 | Mar Sales S2 |
| … | … | Store2 | Dec Sales S2 |
So we can train a single model on the above reduced data set and have a Panel Forecaster. The Decision Tree/GBM/RF will make the first split based on the Panel Id(which will amount to maximum reduction of variance in the data), after which, to put it loosley - the case almost becomes univariate(internal to the Decision Tree), a naive depiction below. (Plotting a feature importance plot for the Decision Tree should show the Panel ID column to be the most important one.)
Advantage- In a practical setting where we have 1000s of SKU time series to train as in Retail, a Single Model will be sufficient instead of 1000 different univariate models.
Caveats -
- Boosting models don’t do well when it comes to capturing trend, this can be taken care of by using differences of the values across different lags as exogenous/ fitting a differenced series like ARIMA etc.
Note - Seasonality can be captured by using Date-time indicators like Month/Day of Week etc. as Categorical Exogenous variables.
References-
Describe the solution you’d like A clear and concise description of what you want to happen, ideally taking into consideration the existing toolbox design, classes and methods.
Describe alternatives you’ve considered A clear and concise description of any alternative solutions or features you’ve considered.
Additional context Add any other context or screenshots about the feature request here.
Issue Analytics
- State:

- Created 2 years ago
- Reactions:1
- Comments:9
 Top Related StackOverflow Question
 Troubleshoot Live Code
 Top Related Reddit Thread
 Top Related Hackernoon Post
 Top Related Tweet
 Top Related Dev.to Post
 Top Related Hashnode Post
Thanks @satya-pattnaik! Not much, just more quotes 😄
These methods were used by the majority of the high ranking M5 submissions. The paper The M5 Accuracy competition: Results, findings and conclusions lists the findings from the accuracy comp in M5. One of the findings is the value of cross-learning:
" In the previous M competitions, most of the series were uncorrelated, of a different frequency and domain, and chronologically unaligned. Therefore, although both of the top-performing submissions of M4 considered “cross-learning” from multiple series concurrently, instead of one series at a time, their approach was difficult to implement effectively in practice, and did not demonstrate the full potential of the approach. In contrast, since the M5 consisted of aligned, highly-correlated series structured in a hierarchical fashion, “cross-learning” was made much easier to apply, achieving superior results when compared to methods that were trained in a series-by-series fashion. Note that, apart from resulting in more accurate forecasts, “cross-learning” implies the use of a single model instead of multiple ones, each trained on the data of a different series, thus reducing overall computational cost and mitigating difficulties related to limited historical observations. Essentially, all top 50 performing methods in M5 utilized “cross-learning”, exploiting all the information being offered by the dataset."
As mentioned above - in the case of M5 the global forecasting methods can also be seen as hierarchical as the product / store hierarchy was introduced in the model as categorical variables. Interested to hear @fkiraly’s opinion on this and the implications on a hierarchical forecasting API!
In terms of the data container, in my custom implementation of this, I’ve used a long format pandas dataframe similar to the format from @satya-pattnaik here:
The format that you have shown here @aiwalter is suited for Vector Forecasting. Vector forecasting in such a scenario makes sense when there is inter-dependency between “Sales_1”, “Sales_2”(might be because of competition). A use case for this is - when forecasting sales of items inside the “same” category. Two items of same category but different brands might have inter-dependence(in their sales) because of promotions, discount on one affects the sales of the other(adversely).
CAT1_DELLT = L1 * CAT1_DELLT-1 + L2 * CAT1_MACT-1 + e1 CAT1_MACT = M1 * CAT1_MACT-1 + M2 * CAT1_DELLT-1 + e2
Here the forecast is based on “joint evolution” of both the series(for example).
However, I argue that it doesn’t make sense to have Vector Forecast when we are considering data across different stores/geographic locations/categories as there might not be any inter-dependence.
For e.g in the M5 data - vector forecasting sales of items from “HOUSEHOLD” category and “FOOD” category will not be helpful.
I am not sure how to vector forecast using Decision Trees, the way that I know is the one I mentioned above(which is a proxy to vector forecasting) where we pass the “group ids” as categorical indicators and the lags to be grouped by the respective group ids. Will be happy to discuss more on this. Anything you want to add @ltsaprounis?