
Lightrun Answers was designed to reduce the constant googling that comes with debugging 3rd party libraries. It collects links to all the places you might be looking at while hunting down a tough bug.
And, if you’re still stuck at the end, we’re happy to hop on a call to see how we can help out.
TSF importance curve normalization (remove bias)
See original GitHub issueIs your feature request related to a problem? Please describe. The TimeSeriesForestCLassifier computes the importance curve for each of the extracted features in each time index. However, as the authors point out “different time indices are associated with different numbers of intervals”, and, in particular, “the indices in the middle have more intervals than the indices on the edges of the time series”. The importance curves are, hence, biased towards the time points having more interval features.
Describe the solution you’d like I propose to normalize the importance curve at each point by dividing the importance by the number of intervals that the point is part of. The authors mention that the number of intervals each time t in part of is t(L-t+1), where L is the length of the time series. However, I think that it’s better to use the empirical number of intervals each point is part of, given that this information can be easily obtained. For this, firstly, the empirical number of random intervals each point is included in is calculated and then the importance curves are divided by this value.
This can easily be done by adding the fis_count lines in the feature_importances_ function (line 290) in sktime/sktime/series_as_features/base/estimators/_ensemble.py. The new function would be:
def feature_importances_(self):
"""Compute feature importances for time series forest"""
# assumes particular structure of clf,
# with each tree consisting of a particular pipeline,
# as in modular tsf

if not isinstance(
  self.estimators_[0].steps[0][1], RandomIntervalFeatureExtractor
):
  raise NotImplementedError(
      "RandomIntervalFeatureExtractor must"
      " be used as the transformer,"
      " which must be the first step"
      " in the base estimator."
  )

# get series length, assuming same length series
tree = self.estimators_[0]
transformer = tree.steps[0][1]
time_index = transformer._time_index
n_timepoints = len(time_index)

# get feature names, features are the same for all trees
feature_names = [feature.__name__ for feature in transformer.features]
n_features = len(feature_names)

# get intervals from transformer,
# the number of intervals is the same for all trees

intervals = transformer.intervals_
n_intervals = len(intervals)

# get number of estimators
n_estimators = len(self.estimators_)

# preallocate array for feature importances
fis = np.zeros((n_timepoints, n_features))
<b>fis_count = np.zeros((n_timepoints, n_features))<b>

for i in range(n_estimators):
  # select tree
  tree = self.estimators_[i]
  transformer = tree.steps[0][1]
  classifier = tree.steps[-1][1]

  # get intervals from transformer
  intervals = transformer.intervals_

  # get feature importances from classifier
  fi = classifier.feature_importances_

  for k in range(n_features):
      for j in range(n_intervals):
          # get start and end point from interval
          start, end = intervals[j]

          # get time index for interval
          interval_time_points = np.arange(start, end)

          # get index for feature importances,
          # assuming particular order of features

          column_index = (k * n_intervals) + j

          fis_count[interval_time_points, k] += 1

          # add feature importance for all time points of interval
          fis[interval_time_points, k] += fi[column_index]

# normalise by number of estimators and number of intervals
fis = fis / n_estimators / n_intervals
fis_count =  fis_count / n_estimators / n_intervals

# format output
fis = pd.DataFrame(fis, columns=feature_names, index=time_index)
fis_count = pd.DataFrame(fis_count, columns=feature_names, index=time_index)
fis_norm = fis/fis_count

return fis_norm
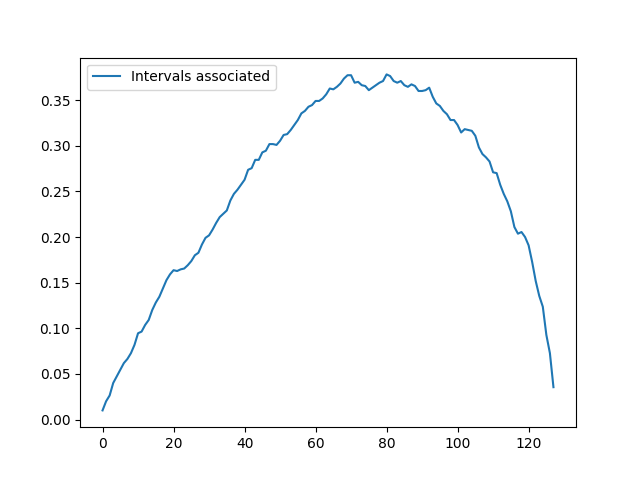
An example of the empirical number (normalized by n_estimators and n_intervals) of intervals each point is included in for an instance of the CBF dataset is shown above:
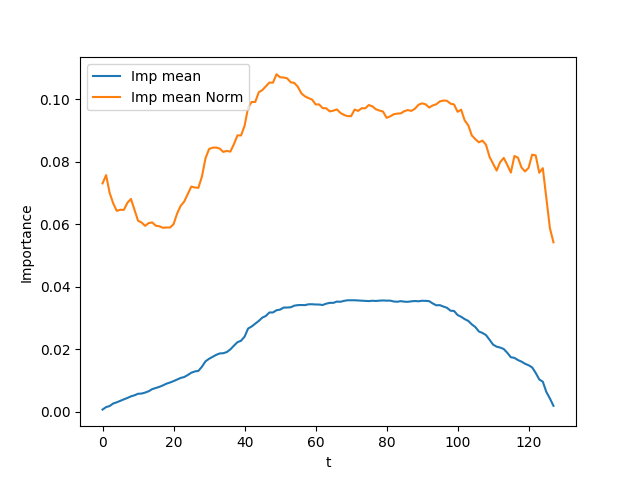
Finally, an example of the importance curve for the mean feature before and after the normalization for an instance of the CBF dataset is shown above:
Issue Analytics
- State:

- Created 3 years ago
- Reactions:1
- Comments:9 (5 by maintainers)
 Top Related StackOverflow Question
 Troubleshoot Live Code
 Top Related Reddit Thread
 Top Related Hackernoon Post
 Top Related Tweet
 Top Related Dev.to Post
 Top Related Hashnode Post
Included in the above PR.
I agree with @MatthewMiddlehurst , feel free @Dbhasin1