
Stuck on an issue?
Lightrun Answers was designed to reduce the constant googling that comes with debugging 3rd party libraries. It collects links to all the places you might be looking at while hunting down a tough bug.
And, if you’re still stuck at the end, we’re happy to hop on a call to see how we can help out.
Metric pods are not setting a sourcetype
See original GitHub issueWhat happened:
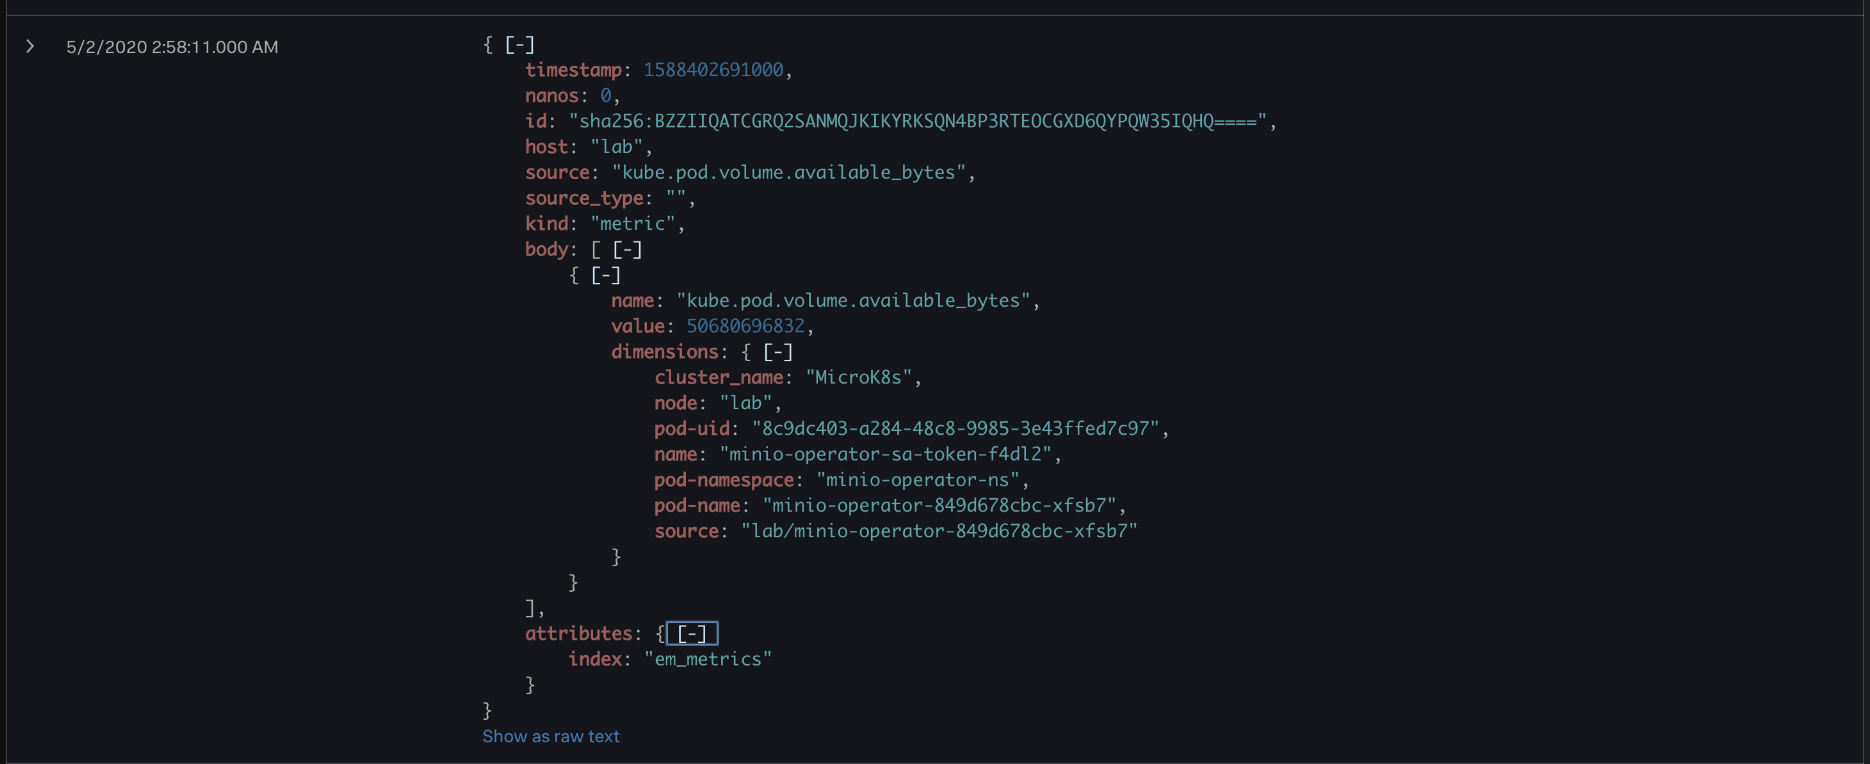
Kubernetes Metrics pods do not set a sourcetype.
What you expected to happen:
We should be setting a sourcetype.
How to reproduce it (as minimally and precisely as possible):
deploy SCK metrics chart and examine metric payload
Anything else we need to know?:
This is likely best fixed in a rfull eview of field names we are senfing as the field names are not cleanly normalized to ensure they match across metric types
Environment:
- Kubernetes version (use
kubectl version):
1.18
- Ruby version (use
ruby --version): - OS (e.g:
cat /etc/os-release): Ubuntu 18.04 - Splunk version: 8.0.3
- Others: DSP 1.1 pictured above
Issue Analytics
- State:

- Created 3 years ago
- Comments:5
 Top Results From Across the Web
Create HorizontalPodAutoscaler Resource
HorizontalPodAutoscaler is the configuration for a horizontal pod ... It will always be set, regardless of the corresponding metric specification.
Read more >Nodes OpenShift Container Platform 4.10
This document provides instructions for configuring and managing the nodes, Pods, and containers in your cluster. It also provides information on ...
Read more >Collect Kubernetes metrics and logs with Splunk App for ...
Collect metrics and log data from a Kubernetes cluster with the easy install script in the Splunk App for Infrastructure (SAI). When you...
Read more >Adding a rule, filter, and index in Fluentd configuration map
Use the sample Fluentd configuration map to add a rule, filter, and index to Fluentd. Modify your Fluentd configuration map to add a...
Read more >Monitoring Kubernetes | Troubleshooting
Pod is not getting scheduled; Failed to pull the image ... including performance, metrics and configuration (excluding splunk URL and Token).
Read more > Top Related Medium Post
No results found
 Top Related StackOverflow Question
No results found
 Troubleshoot Live Code
Lightrun enables developers to add logs, metrics and snapshots to live code - no restarts or redeploys required.
Start Free Top Related Reddit Thread
No results found
 Top Related Hackernoon Post
No results found
 Top Related Tweet
No results found
 Top Related Dev.to Post
No results found
 Top Related Hashnode Post
No results found
Yeah I would keep in line with the other sourcetypes SCK sends which already use the “kube:container:foo” or “kube:objects:bar”.
This format is also inline with other Splunk addon sourcetype naming conventions.
@matthewmodestino Thanks for quick reply. Source will look like
sck-splunk-kubernetes-metricsandsck-splunk-kubernetes-metrics-aggregatorin splunk.kube:metricsorkube:metrics:aggis better option IMO Thanks.