TransactionalTestExecutionListener Hotspot
See original GitHub issueAffects: Spring 5.2.4
We have a relatively large, monolithic Spring Boot application and I have been doing some profiling of our integration tests. For context, our application has 1127 bean definitions and a majority of our performance issues are in our code base.
However, I did find a hotspot in the TransactionalTestExecutionListener. It has two methods to find annotated methods on the test class: runBeforeTransactionMethods() and runAfterTransactionMethods.
I am using JProfiler with full instrumentation, so the times are skewed :

After looking at the code for a bit, I extended the listener to cache the list of methods for a given class and replaced the the default listener with our custom listener:
public class CachingTransactionalTestExecutionListener extends TransactionalTestExecutionListener {


	/**
	 * A cache of class -> methods annotated with BeforeTransaction.
	 */
	private static LruClassMethodCache beforeTransactionMethodCache = new LruClassMethodCache(4);

	/**
	 * A cache of class -> methods annotated with AfterTransaction.
	 */
	private static LruClassMethodCache afterTransactionMethodCache = new LruClassMethodCache(4);

	@Override
	protected void runBeforeTransactionMethods(TestContext testContext) throws Exception {

		try {
			List<Method> methods = beforeTransactionMethodCache.get(testContext.getTestClass());
			if (methods == null) {

				methods = getAnnotatedMethods(testContext.getTestClass(), BeforeTransaction.class);
				Collections.reverse(methods);
				for (Method method : methods) {
					ReflectionUtils.makeAccessible(method);
				}
				beforeTransactionMethodCache.put(testContext.getTestClass(), methods);
			}
			for (Method method : methods) {
				if (logger.isDebugEnabled()) {
					logger.debug("Executing @BeforeTransaction method [" + method + "] for test context " + testContext);
				}
				method.invoke(testContext.getTestInstance());
			}
		}
		catch (InvocationTargetException ex) {
			if (logger.isErrorEnabled()) {
				logger.error("Exception encountered while executing @BeforeTransaction methods for test context " +
						testContext + ".", ex.getTargetException());
			}
			ReflectionUtils.rethrowException(ex.getTargetException());
		}
	}

	protected void runAfterTransactionMethods(TestContext testContext) throws Exception {
		Throwable afterTransactionException = null;

		List<Method> methods = afterTransactionMethodCache.get(testContext.getTestClass());
		if (methods == null) {
			methods = getAnnotatedMethods(testContext.getTestClass(), AfterTransaction.class);
			for (Method method : methods) {
					if (logger.isDebugEnabled()) {
						logger.debug("Executing @AfterTransaction method [" + method + "] for test context " + testContext);
					}
					ReflectionUtils.makeAccessible(method);
			}
			afterTransactionMethodCache.put(testContext.getTestClass(), methods);
		}

		for (Method method : methods) {
			try {
				if (logger.isDebugEnabled()) {
					logger.debug("Executing @AfterTransaction method [" + method + "] for test context " + testContext);
				}
				method.invoke(testContext.getTestInstance());
			}
			catch (InvocationTargetException ex) {
				Throwable targetException = ex.getTargetException();
				if (afterTransactionException == null) {
					afterTransactionException = targetException;
				}
				logger.error("Exception encountered while executing @AfterTransaction method [" + method +
						"] for test context " + testContext, targetException);
			}
			catch (Exception ex) {
				if (afterTransactionException == null) {
					afterTransactionException = ex;
				}
				logger.error("Exception encountered while executing @AfterTransaction method [" + method +
						"] for test context " + testContext, ex);
			}
		}

		if (afterTransactionException != null) {
			ReflectionUtils.rethrowException(afterTransactionException);
		}
	}

// ...

	private static class LruClassMethodCache extends LinkedHashMap<Class<?>, List<Method>> {

		/**
		 * Create a new {@code LruCache} with the supplied initial capacity
		 * and load factor.
		 * @param initialCapacity the initial capacity
		 * @param loadFactor the load factor
		 */
		LruClassMethodCache(int initialCapacity) {
			super(initialCapacity);
		}

		@Override
		protected boolean removeEldestEntry(Map.Entry<Class<?>, List<Method>> eldest) {
			if (size() > 4) {
				return true;
			} else {
				return false;
			}
		}
	}

	static class PostProcessor implements DefaultTestExecutionListenersPostProcessor {

		@Override
		public Set<Class<? extends TestExecutionListener>> postProcessDefaultTestExecutionListeners(
				Set<Class<? extends TestExecutionListener>> listeners) {
			Set<Class<? extends TestExecutionListener>> updated = new LinkedHashSet<>(listeners.size());
			for (Class<? extends TestExecutionListener> listener : listeners) {				updated.add(listener.equals(TransactionalTestExecutionListener.class)
						? CachingTransactionalTestExecutionListener.class : listener);
			}
			return updated;
		}
To test this, I created 10 IT classes (each with 50 methods), and just do a simple assert. :
public class Example1IT  extends BaseDaoTest  {

	@Test
	public void test1() {
		assertThat("This String").isNotNull();
	}
	@Test
	public void test2() {
		assertThat("This String").isNotNull();
	}

	// ...

	@Test
	public void test50() {
		assertThat("This String").isNotNull();
	}
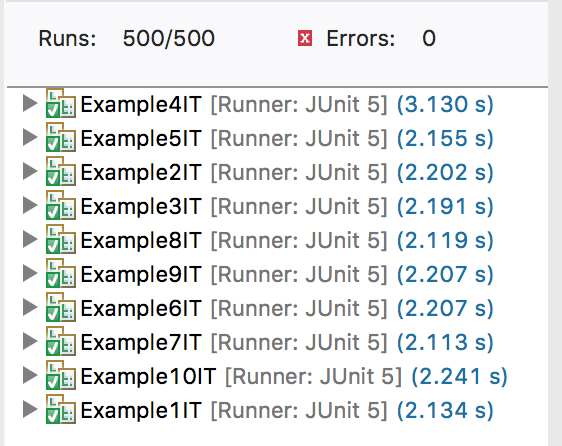
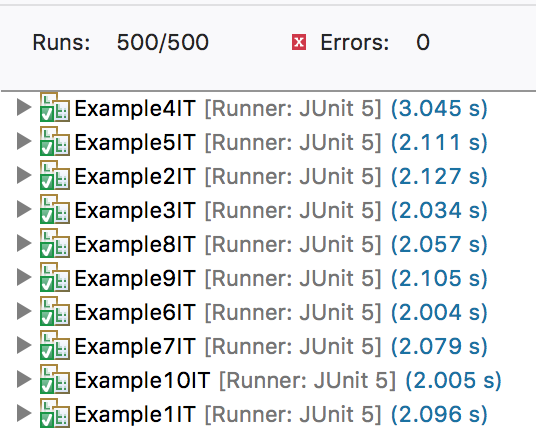
There is some “noise” because I am running this on my machine but the results look promising (but definitely not scientific 8)
After this change, the hotspot is no longer present in our profiling results and when running those 500 tests with no profiler in play:
Before:

After:

I wish I could report back how this change impacts our 8000+ integration test but I am currently working from home and the database activity over the VPN makes it very difficult to get repeatable results.
Issue Analytics
- State:
- Created 3 years ago
- Comments:9 (4 by maintainers)

 Top Related StackOverflow Question
If you feel that it would make a noticeable difference, feel free to raise issues in Spring Boot’s issue tracker for those.
yeah, I wasn’t sure what size to make it, for the most part our tests run single-threaded. One thing I can try this morning is to add some timers around those methods and then report to results on shutdown, just so I can better quantify the actual time in our integration tests. I will let you know what I find. There are two additional
TestExecutionListnersin the Spring Boot project that also have hotspots, if you think this sort of profiling is useful, I can open an issue with them as well.