
Lightrun Answers was designed to reduce the constant googling that comes with debugging 3rd party libraries. It collects links to all the places you might be looking at while hunting down a tough bug.
And, if you’re still stuck at the end, we’re happy to hop on a call to see how we can help out.
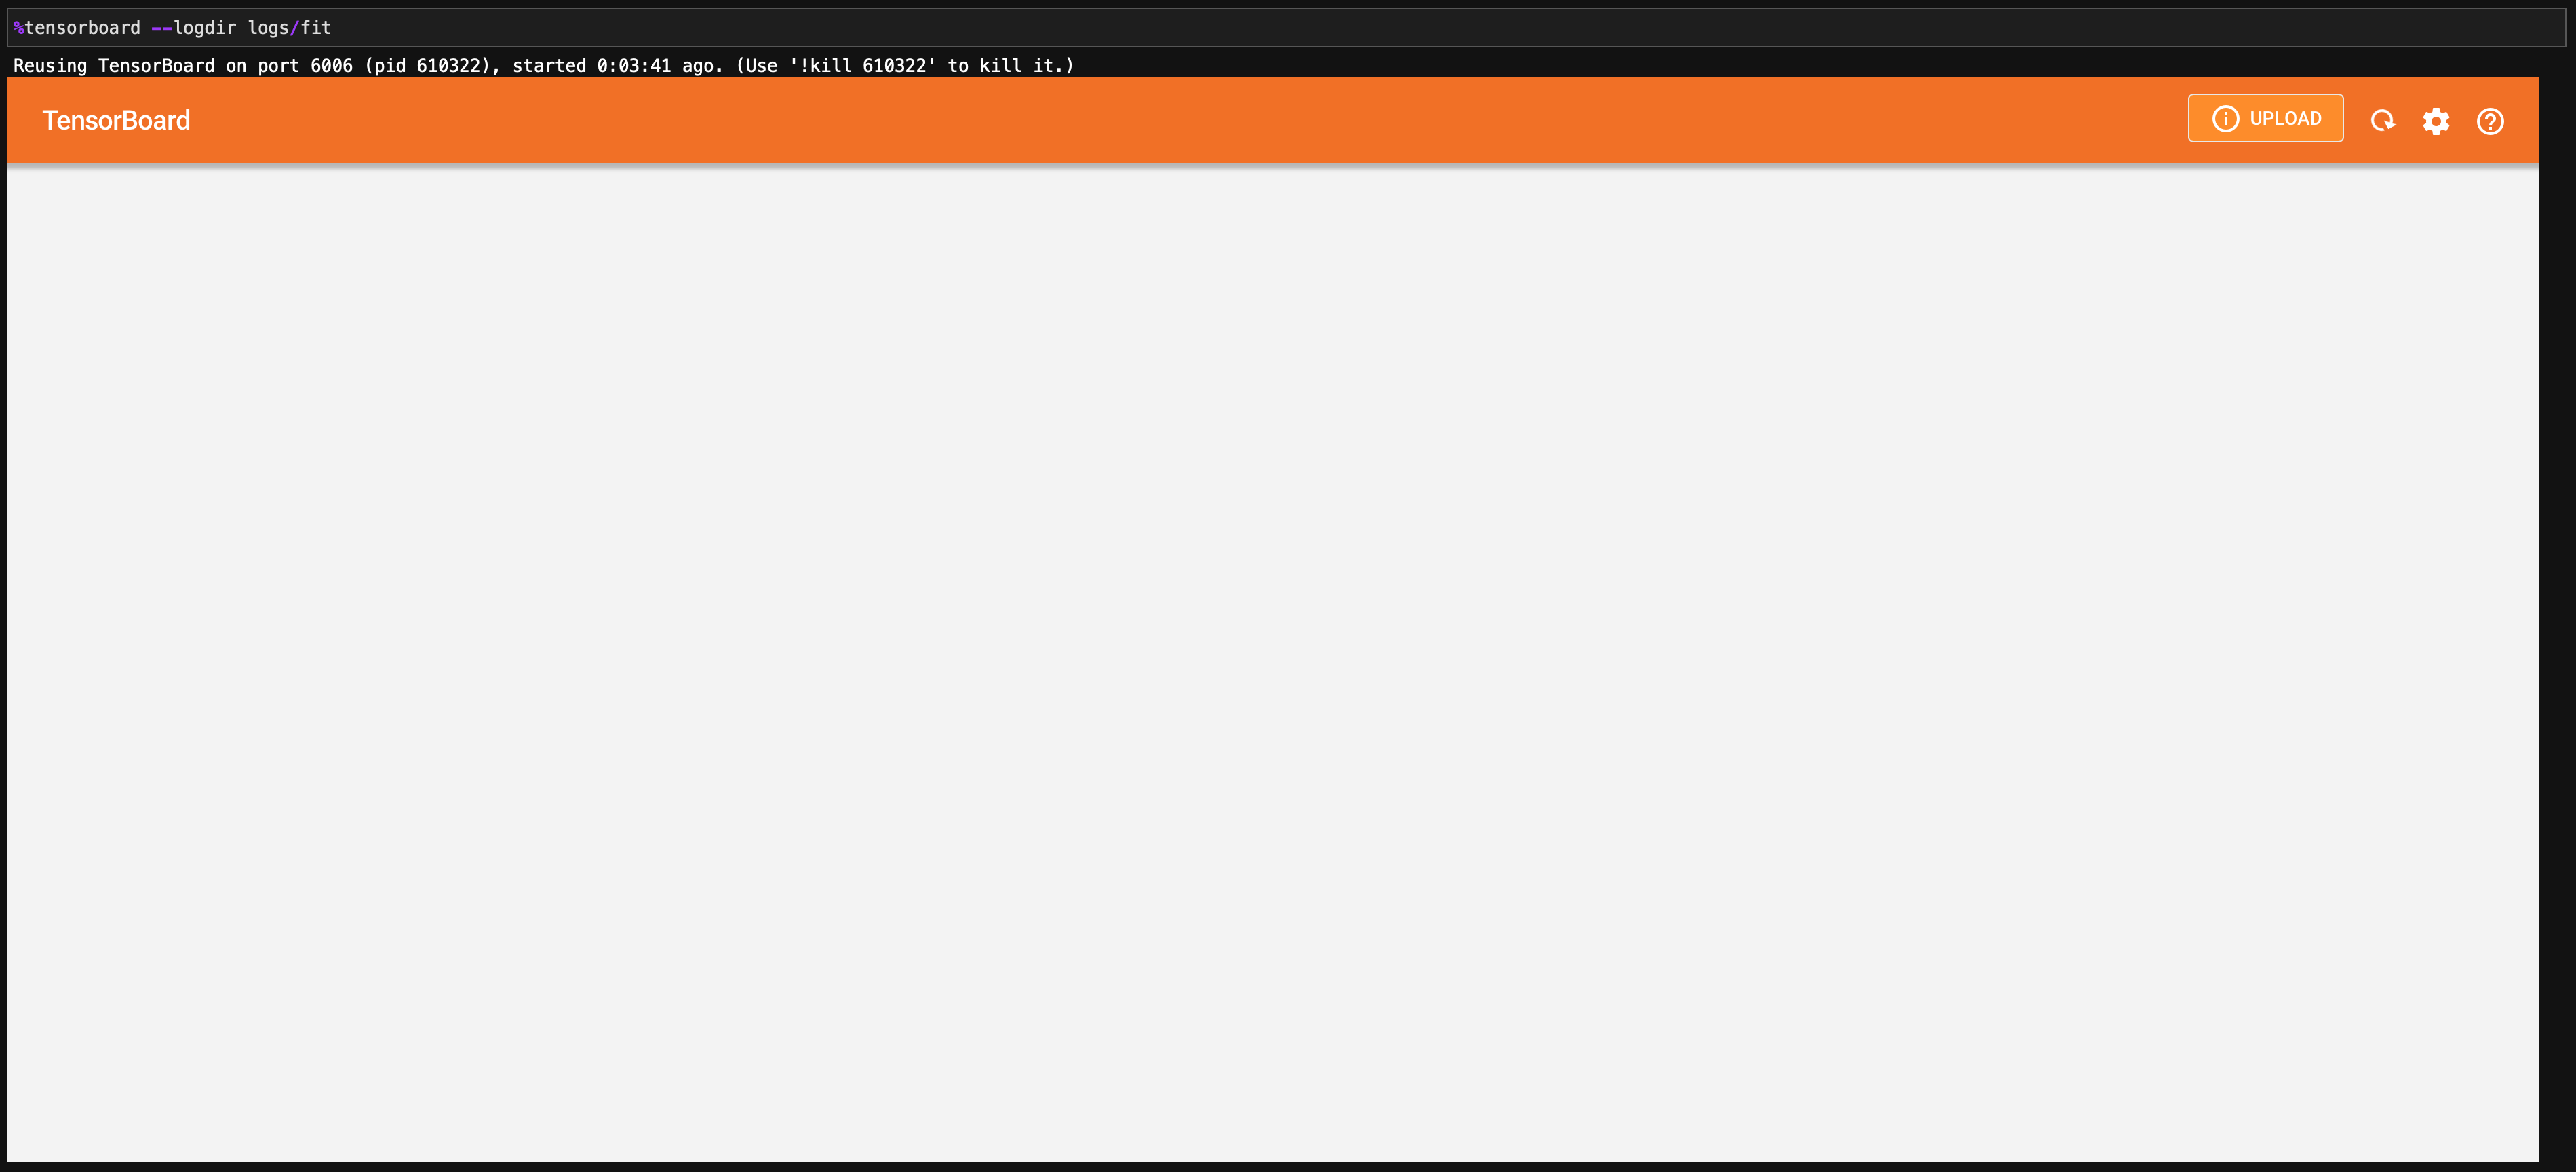
Visible top bar, rotating loading icon, nothing loads below.
See original GitHub issueIssue
Tensorboard browser does not load or show any results. A screenshot:
Please let me know if there is any other diagnostics I can do.
Environment information (required)
Diagnostics
Diagnostics output
--- check: autoidentify
INFO: diagnose_tensorboard.py version e43767ef2b648d0d5d57c00f38ccbd38390e38da

--- check: general
INFO: sys.version_info: sys.version_info(major=3, minor=8, micro=5, releaselevel='final', serial=0)
INFO: os.name: posix
INFO: os.uname(): posix.uname_result(sysname='Linux', nodename='amsterdam', release='5.8.0-41-generic', version='#46~20.04.1-Ubuntu SMP Mon Jan 18 17:52:23 UTC 2021', machine='x86_64')
INFO: sys.getwindowsversion(): N/A

--- check: package_management
INFO: has conda-meta: False
INFO: $VIRTUAL_ENV: 'REDACTED/.venv'

--- check: installed_packages
INFO: installed: tensorboard==2.5.0
INFO: installed: tensorflow==2.5.0
INFO: installed: tensorflow-estimator==2.5.0
INFO: installed: tensorboard-data-server==0.6.1

--- check: tensorboard_python_version
INFO: tensorboard.version.VERSION: '2.5.0'

--- check: tensorflow_python_version
2021-07-02 19:25:12.632593: I tensorflow/stream_executor/platform/default/dso_loader.cc:53] Successfully opened dynamic library libcudart.so.11.0
INFO: tensorflow.__version__: '2.5.0'
INFO: tensorflow.__git_version__: 'v2.5.0-rc3-213-ga4dfb8d1a71'

--- check: tensorboard_data_server_version
INFO: data server binary: 'REDACTED/.venv/lib/python3.8/site-packages/tensorboard_data_server/bin/server'
INFO: data server binary version: b'rustboard 0.6.1'

--- check: tensorboard_binary_path
INFO: which tensorboard: b'REDACTED/.venv/bin/tensorboard\n'

--- check: addrinfos
socket.has_ipv6 = True
socket.AF_UNSPEC = <AddressFamily.AF_UNSPEC: 0>
socket.SOCK_STREAM = <SocketKind.SOCK_STREAM: 1>
socket.AI_ADDRCONFIG = <AddressInfo.AI_ADDRCONFIG: 32>
socket.AI_PASSIVE = <AddressInfo.AI_PASSIVE: 1>
Loopback flags: <AddressInfo.AI_ADDRCONFIG: 32>
Loopback infos: [(<AddressFamily.AF_INET6: 10>, <SocketKind.SOCK_STREAM: 1>, 6, '', ('::1', 0, 0, 0)), (<AddressFamily.AF_INET: 2>, <SocketKind.SOCK_STREAM: 1>, 6, '', ('127.0.0.1', 0))]
Wildcard flags: <AddressInfo.AI_PASSIVE: 1>
Wildcard infos: [(<AddressFamily.AF_INET: 2>, <SocketKind.SOCK_STREAM: 1>, 6, '', ('0.0.0.0', 0)), (<AddressFamily.AF_INET6: 10>, <SocketKind.SOCK_STREAM: 1>, 6, '', ('::', 0, 0, 0))]

--- check: readable_fqdn
INFO: socket.getfqdn(): 'amsterdam'

--- check: stat_tensorboardinfo
INFO: directory: /tmp/.tensorboard-info
INFO: os.stat(...): os.stat_result(st_mode=16895, st_ino=1048693, st_dev=66307, st_nlink=2, st_uid=1007, st_gid=1007, st_size=4096, st_atime=1625267174, st_mtime=1625267173, st_ctime=1625267173)
INFO: mode: 0o40777

--- check: source_trees_without_genfiles
INFO: tensorboard_roots (1): ['REDACTED/.venv/lib/python3.8/site-packages']; bad_roots (0): []

--- check: full_pip_freeze
INFO: pip freeze --all:
absl-py==0.13.0
argon2-cffi==20.1.0
astunparse==1.6.3
async-generator==1.10
attrs==21.2.0
backcall==0.2.0
bleach==3.3.0
cachetools==4.2.2
certifi==2021.5.30
cffi==1.14.5
chardet==4.0.0
debugpy==1.3.0
decorator==5.0.9
defusedxml==0.7.1
entrypoints==0.3
flatbuffers==1.12
gast==0.4.0
google-auth==1.32.1
google-auth-oauthlib==0.4.4
google-pasta==0.2.0
grpcio==1.34.1
h5py==3.1.0
idna==2.10
ipykernel==6.0.1
ipython==7.25.0
ipython-genutils==0.2.0
ipywidgets==7.6.3
jedi==0.18.0
Jinja2==3.0.1
jsonschema==3.2.0
jupyter==1.0.0
jupyter-client==6.1.12
jupyter-console==6.4.0
jupyter-core==4.7.1
jupyterlab-pygments==0.1.2
jupyterlab-widgets==1.0.0
keras-nightly==2.5.0.dev2021032900
Keras-Preprocessing==1.1.2
Markdown==3.3.4
MarkupSafe==2.0.1
matplotlib-inline==0.1.2
mistune==0.8.4
nbclient==0.5.3
nbconvert==6.1.0
nbformat==5.1.3
nest-asyncio==1.5.1
notebook==6.4.0
numpy==1.19.5
oauthlib==3.1.1
opt-einsum==3.3.0
packaging==20.9
pandocfilters==1.4.3
parso==0.8.2
pexpect==4.8.0
pickleshare==0.7.5
pip==20.1.1
prometheus-client==0.11.0
prompt-toolkit==3.0.19
protobuf==3.17.3
ptyprocess==0.7.0
pyasn1==0.4.8
pyasn1-modules==0.2.8
pycparser==2.20
Pygments==2.9.0
pyparsing==2.4.7
pyrsistent==0.18.0
python-dateutil==2.8.1
pyzmq==22.1.0
qtconsole==5.1.1
QtPy==1.9.0
requests==2.25.1
requests-oauthlib==1.3.0
rsa==4.7.2
Send2Trash==1.7.1
setuptools==47.1.0
six==1.15.0
tensorboard==2.5.0
tensorboard-data-server==0.6.1
tensorboard-plugin-wit==1.8.0
tensorflow==2.5.0
tensorflow-estimator==2.5.0
termcolor==1.1.0
terminado==0.10.1
testpath==0.5.0
tornado==6.1
traitlets==5.0.5
typing-extensions==3.7.4.3
urllib3==1.26.6
wcwidth==0.2.5
webencodings==0.5.1
Werkzeug==2.0.1
wheel==0.36.2
widgetsnbextension==3.5.1
wrapt==1.12.1
Next steps
No action items identified. Please copy ALL of the above output, including the lines containing only backticks, into your GitHub issue or comment. Be sure to redact any sensitive information.
Steps to reproduce (required)
$ which python
/home/yavuz/miniconda3/bin/python
$ python -m venv .venv
$ source .venv/bin/activate
(.venv) $ pip install tensorflow
After above, I only ran the sample notebook from https://storage.googleapis.com/tensorflow_docs/tensorboard/docs/get_started.ipynb
Also, here is tensorboard --inspect result:
(.venv) $ tensorboard --inspect --logdir=logs
2021-07-02 19:42:29.673052: I tensorflow/stream_executor/platform/default/dso_loader.cc:53] Successfully opened dynamic library libcudart.so.11.0
======================================================================
Processing event files... (this can take a few minutes)
======================================================================

Found event files in:
logs/fit/20210702-191953/train
logs/fit/20210702-191953/validation

These tags are in logs/fit/20210702-191953/train:
audio -
histograms
   dense/bias_0
   dense/kernel_0
   dense_1/bias_0
   dense_1/kernel_0
images -
scalars
   epoch_accuracy
   epoch_loss
tensor
   batch_2
   keras
======================================================================

Event statistics for logs/fit/20210702-191953/train:
audio -
graph
   first_step           0
   last_step            0
   max_step             0
   min_step             0
   num_steps            1
   outoforder_steps     []
histograms
   first_step           0
   last_step            0
   max_step             0
   min_step             0
   num_steps            1
   outoforder_steps     []
images -
scalars
   first_step           0
   last_step            0
   max_step             0
   min_step             0
   num_steps            1
   outoforder_steps     []
sessionlog:checkpoint -
sessionlog:start -
sessionlog:stop -
tensor
   first_step           0
   last_step            2
   max_step             2
   min_step             0
   num_steps            2
   outoforder_steps     []
======================================================================

These tags are in logs/fit/20210702-191953/validation:
audio -
histograms -
images -
scalars
   epoch_accuracy
   epoch_loss
   evaluation_accuracy_vs_iterations
   evaluation_loss_vs_iterations
tensor -
======================================================================

Event statistics for logs/fit/20210702-191953/validation:
audio -
graph -
histograms -
images -
scalars
   first_step           1875
   last_step            0
   max_step             1875
   min_step             0
   num_steps            2
   outoforder_steps     [(1875, 0)]
sessionlog:checkpoint -
sessionlog:start -
sessionlog:stop -
tensor -
======================================================================
Issue Analytics
- State:

- Created 2 years ago
- Comments:5 (2 by maintainers)
 Top Related StackOverflow Question
 Troubleshoot Live Code
 Top Related Reddit Thread
 Top Related Hackernoon Post
 Top Related Tweet
 Top Related Dev.to Post
 Top Related Hashnode Post
Hey, I could solve it. In my case I’m using pytorch and I uninstalled the package “torch-tb-profiler” and then tensorboard works just fine. I came with this solution after reading #5076. Basically it’s the same issue. Hope it works for you as well.
@arghyaganguly thanks for the feedback. Indeed removing the pytorch plugin fixes the issue. I could trace the underlying problem in torch profiler plugin code (PR pytorch/kineto#335), hope that will provide the fix.