
Stuck on an issue?
Lightrun Answers was designed to reduce the constant googling that comes with debugging 3rd party libraries. It collects links to all the places you might be looking at while hunting down a tough bug.
And, if you’re still stuck at the end, we’re happy to hop on a call to see how we can help out.
TypeError: performance.now is not a function when using lightweight chart
See original GitHub issueLightweight Charts Version: 3.7.0
Steps/code to reproduce: I import the script like this
<script src="https://unpkg.com/lightweight-charts/dist/lightweight-charts.standalone.production.js"></script>
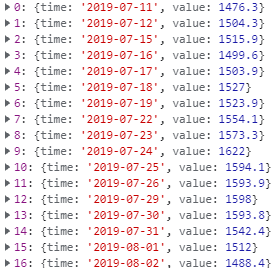
I get the data set from Google cloud firestore as the input
<script type="text/javascript">
    $(document).ready(function() {
        db.collection('爬蟲歷史資料').doc("費半").collection("歷史價錢").get().then((documents) => {
            var histData = []
            documents.forEach(function(doc) {
                var json = {
                    'time': doc.id,
                    'value': parseFloat(doc.data().price.toString().replace(",", ""))
                }
                histData.push(json);
            })
            console.log(histData)
                // 建立技術分析圖
            var width = document.getElementById("stock-chart").getBoundingClientRect().width * 1.05;
            var height;
            if (screen.width <= 1920) {
                height = 500;
            } else if (screen.width <= 3840) {
                height = 1120;
            }

            var dest = document.getElementById("SOX");
            var chart = LightweightCharts.createChart(dest, {
                width: width,
                height: height,
                layout: {
                    textColor: '#d1d4dc',
                    backgroundColor: 'rgba(0, 0, 5, 0.9)',
                },
                rightPriceScale: {
                    scaleMargins: {
                        top: 0.3,
                        bottom: 0.25,
                    },
                },
                crosshair: {
                    vertLine: {
                        width: 5,
                        color: 'rgba(224, 227, 235, 0.1)',
                        style: 0,
                    },
                    horzLine: {
                        visible: false,
                        labelVisible: false,
                    },
                },
                grid: {
                    vertLines: {
                        color: 'rgba(42, 46, 57, 0.8)',
                    },
                    horzLines: {
                        color: 'rgba(42, 46, 57, 0.8)',
                    },
                },
            });

            var areaSeries = chart.addAreaSeries({
                topColor: 'rgba(38, 198, 218, 0)',
                bottomColor: 'rgba(38, 198, 218, 0)',
                lineColor: 'rgba(51, 51, 255, 1)',
                lineWidth: 2,
                crossHairMarkerVisible: false,
            });
            console.log("set data")
            areaSeries.setData(histData);

            dest.style.position = 'relative';

            var legend = document.createElement('div');
            legend.classList.add('legend');
            dest.appendChild(legend);

            var firstRow = document.createElement('div');
            firstRow.innerText = '費半';
            firstRow.style.color = 'white';
            firstRow.style.fontFamily = 'Microsoft JhengHei';
            legend.appendChild(firstRow);

            function pad(n) {
                var s = ('0' + n);
                return s.substr(s.length - 2);
            }

            chart.subscribeCrosshairMove((param) => {
                if (param.time) {
                    const price = param.seriesPrices.get(areaSeries);
                    const date = param.time['year'] + "/" + param.time['month'] + "/" + param.time['day']
                    firstRow.innerText = '費半' + '  ' + date + '  ' + parseFloat(price).toFixed(2);
                } else {
                    firstRow.innerText = '費半';
                }
            });
        });
    });
</script>
Actual behavior:
An error occur when calling var areaSeries = chart.addAreaSeries and the chart only shows background.
Expected behavior:
Originally, it will shows a chart with my own data on it.
Screenshots: Error message
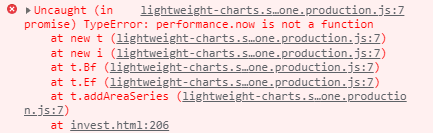
Chart with only background

Console log of the data I got from firestore
Issue Analytics
- State:

- Created 2 years ago
- Comments:9 (5 by maintainers)
 Top Results From Across the Web
global.performance.now is not a function in react native ...
Unable to find any solution to this query. TypeError: global.performance.now is not a function at node_modules/expo/build/ ...
Read more >performance.now() - Web APIs - MDN Web Docs
The performance.now() method returns a DOMHighResTimeStamp, measured in milliseconds.
Read more >TypeError: str.match is not a function | React - EJ 2 Forums
Hello, after having updated my dependencies, I'm getting now the following error when using the TabComponent: Dependencies:.
Read more >Node.js vs PHP: A Head-to-Head Comparison - Kinsta
js has a high-speed execution rate because of its lightweight, efficient, event-driven, and non-blocking I/O model. However, for performance, it ...
Read more >Measuring the Performance of JavaScript Functions - Morioh
The performance API provides access to the DOMHighResTimeStamp through its function performance.now() , which returns the time passed since the page loaded ...
Read more > Top Related Medium Post
No results found
 Top Related StackOverflow Question
No results found
 Troubleshoot Live Code
Lightrun enables developers to add logs, metrics and snapshots to live code - no restarts or redeploys required.
Start Free Top Related Reddit Thread
No results found
 Top Related Hackernoon Post
No results found
 Top Related Tweet
No results found
 Top Related Dev.to Post
No results found
 Top Related Hashnode Post
No results found
I just stopped on the exception and look at the code caused it. You can enable this option in your devtools so you’ll stop on every uncaught exception too so you’ll see call stack, local and global variables at the time.
Thanks a lot! I didn’t notice that. How did you find out? You’re very professional!