
Stuck on an issue?
Lightrun Answers was designed to reduce the constant googling that comes with debugging 3rd party libraries. It collects links to all the places you might be looking at while hunting down a tough bug.
And, if you’re still stuck at the end, we’re happy to hop on a call to see how we can help out.
Colors in sequential scale?
See original GitHub issuePlease see the Vega output of the following VL spec:
{
  "layer": [
    {
      "mark": "rect",
      "encoding": {
        "color": {
          "type": "quantitative", "aggregate": "mean", "field": "precipitation",
          "scale": {
            "domain": [15, 2, 0.1, 0],
            "range": ["purple", "darkorange", "yellow", "white"]
          }
        }
      }
    },
    {
      "mark": "text",
      "encoding": {
        "text": {"type": "quantitative", "aggregate": "mean", "field": "precipitation"}
      }
    }
  ],
  "data": {
    "url": "https://vega.github.io/vega-datasets/data/seattle-weather.csv",
    "format": {"type": "csv"}
  },
  "encoding": {
    "x": {"type": "ordinal", "field": "date", "timeUnit": "day"},
    "y": {"type": "ordinal", "field": "date", "timeUnit": "month"}
  },
  "$schema": "https://vega.github.io/schema/vega-lite/v2.3.0.json"
}
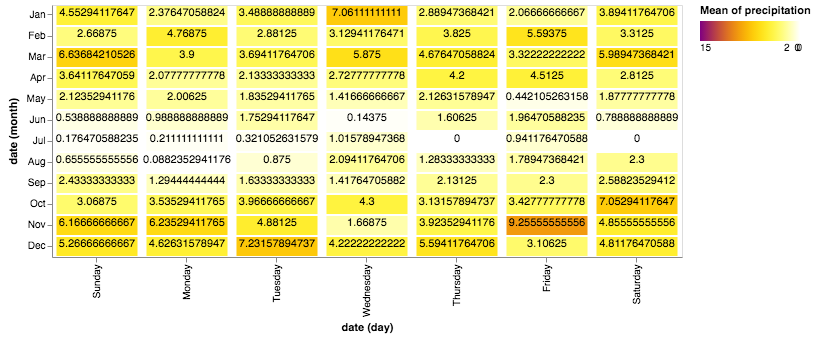
Notice in particular that Wednesdays in June have a value of 0.14, but the color is associated with the value 0 in the scale (or somewhere between 0 and 0.1 at best)
Originally from https://github.com/vega/vega-lite/issues/3631
Issue Analytics
- State:

- Created 5 years ago
- Comments:6 (6 by maintainers)
 Top Results From Across the Web
When to use sequential and when to use diverging color scales
If your story emphasizes the highest (=darkest) values, go for a sequential color scale. If your story is about the lowest and highest...
Read more >How to choose a colour scale for data visualization
Sequential colour schemes are best used in quantitative data which can be logically arranged from high to low. With quantitative data, you ...
Read more >4. Color Scales - Fundamentals of Data Visualization [Book]
Sequential scales can be based on a single hue (e.g., from dark blue to light blue) or on multiple hues (e.g., from dark...
Read more >Color scales - The Wilke Lab
Scale function Aesthetic Data type Palette type
scale_color_hue() color discrete qualitative
scale_fill_hue() fill discrete qualitative
scale_color_gradient() color continuous sequential
Read more >Sequential Scales - Using D3.js
A sequential scale is particularly useful for mapping a continuous interval of numeric values to a series of colors. Below, we describe how...
Read more > Top Related Medium Post
No results found
 Top Related StackOverflow Question
No results found
 Troubleshoot Live Code
Lightrun enables developers to add logs, metrics and snapshots to live code - no restarts or redeploys required.
Start Free Top Related Reddit Thread
No results found
 Top Related Hackernoon Post
No results found
 Top Related Tweet
No results found
 Top Related Dev.to Post
No results found
 Top Related Hashnode Post
No results found
Ok. In Thai, it’s “catch” first. lol
I think it’s bigger fish to fry, not catch 😛