
Lightrun Answers was designed to reduce the constant googling that comes with debugging 3rd party libraries. It collects links to all the places you might be looking at while hunting down a tough bug.
And, if you’re still stuck at the end, we’re happy to hop on a call to see how we can help out.
Hexagons rendered at (0, 0)
See original GitHub issueIssue
I’m trying to recreate the hexagon example, but the hexagons aren’t being rendered at the correct locations.
The data is the road accidents in the UK as per
data = {
  return d3.csv('https://raw.githubusercontent.com/uber-common/deck.gl-data/master/examples/3d-heatmap/heatmap-data.csv', row => {
    return {lng: +row.lng, lat: +row.lat};
  })
Actual Result
In this screenshot I’m showing two layers - a scatterplot and a hexagon
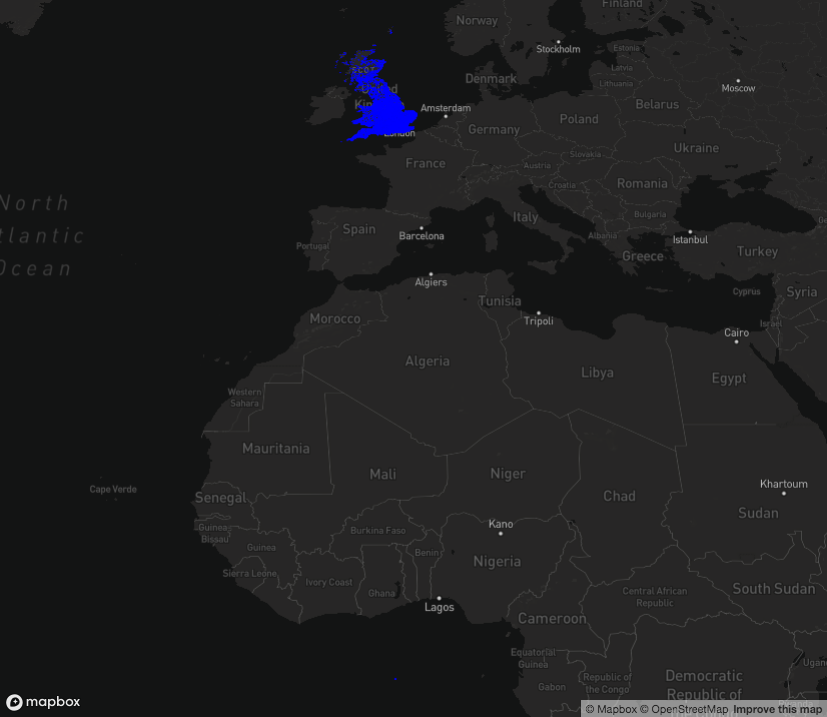
The scatterplot has rendered as expected - the blue dots over the UK
The hexagons have rendered at coordinates (0, 0) (you can see a small blue dot at location (0, 0) off the central-east coast of Africa at the bottom of the image), and I don’t know why.
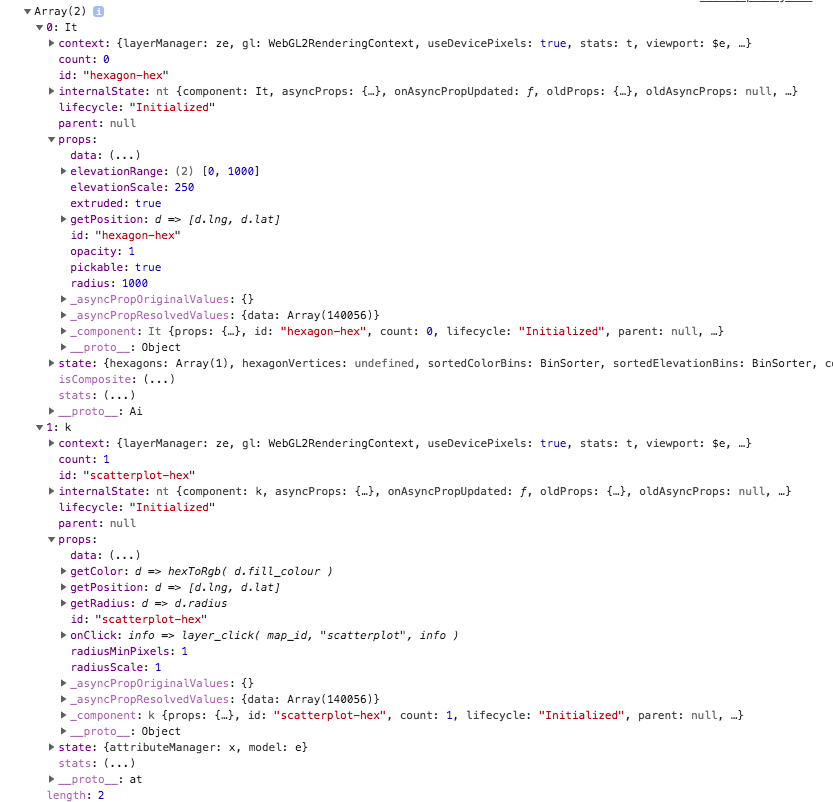
If it helps, this is the log of the hexagon and scatterplot layers
Code Example
The two functions I’m using to create the hexagon and scatterplots are:
const hexagonLayer = new deck.HexagonLayer({
  id: 'hexagon'
  data,
  pickable: true,
  extruded: true,
  elevationRange: [0, 1000],
  elevationScale: 250,
  opacity: 1,
  getPosition: d => [d.lng, d.lat]
});
const scatterLayer = new deck.ScatterplotLayer({
  id: 'scatterplot',
  data,
  radiusScale: 1,
  radiusMinPixels: 1,
  getRadius: d => d.radius,
  getPosition: d => [d.lng, d.lat],
  getColor: d => hexToRgb( d.fill_colour )
});
Both functions are using the same getPosition: d => [d.lng, d.lat] function, and receive the same data object.
Background / extra detail
I’m an R programmer, not a javascript programmer, so I may have missed something obvious.
I’m making an R package (github repo here) which wraps deck.gl. Therefore my js functions are slightly different to the examples, as I have to receive the data from R.
To Do List
- Add label and assign to milestone
- Coding
- Test
Issue Analytics
- State:

- Created 5 years ago
- Comments:18 (12 by maintainers)
 Top Related StackOverflow Question
 Troubleshoot Live Code
 Top Related Reddit Thread
 Top Related Hackernoon Post
 Top Related Tweet
 Top Related Dev.to Post
 Top Related Hashnode Post
Wahey! Works for me in
6.2.1!Thanks again for all your efforts with this lib!
Same issue in v6.2.0 of deckgl.min.js