Metric Columns Blank
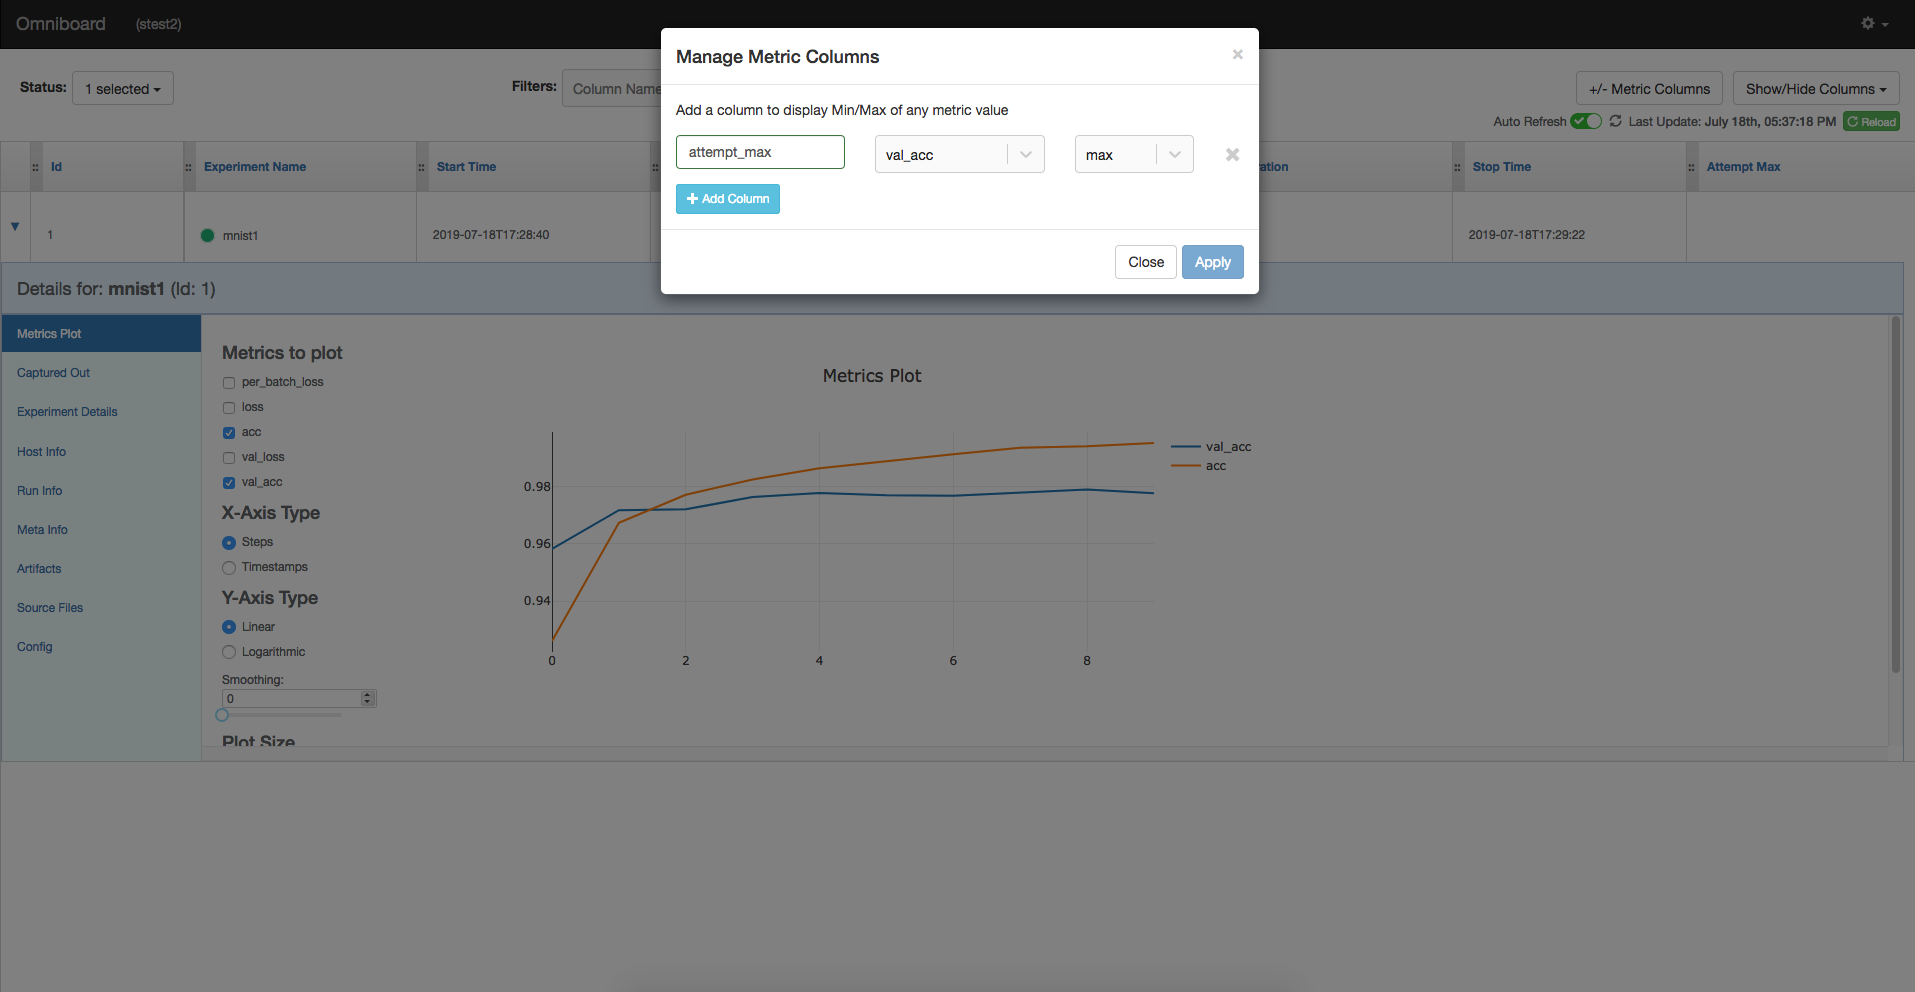
See original GitHub issueFor some reason when I go to add a metric column to Omniboard the column values are all blank. Here is a screenshot:

I am trying to find the maximum validation accuracy, which I have called val_acc. The plot in the picture clearly shows validation accuracy, but when I make the metric column with the configuration shown in the dialog box the resulting column is blank (see blank field in top right).
Omniboard works fine other than this, so obviously it must be mostly working, and I haven’t seen this issue before anywhere else on the issues page.
My system
- OSX
- Issue occurs in firefox and chrome
- omniboard 1.7.1 (latest)
- Mongodb running on linux server, version 3.6.4
Approximate setup: Running code on linux computing cluster, logging to mongodb instance on that cluster. Omniboard is pinging the mongodb via an ssh connection into the cluster.
If it helps, when I ask for the column this is the console output:
fe80::1 - - [18/Jul/2019:07:54:53 +0000] "GET /api/v1/Runs?select=_id,heartbeat,experiment,command,host,stop_time,config,result,start_time,resources,format,status,omniboard,metrics,meta&sort=-_id&query=%7B%22$and%22:[%7B%22$or%22:[%7B%22status%22:%7B%22$eq%22:%22COMPLETED%22%7D%7D]%7D]%7D&populate=%7B%22path%22:%22metrics%22,%22match%22:%7B%22name%22:%7B%22$in%22:[%22val_acc%22]%7D%7D%7D HTTP/1.1" 304 - 32.085 ms
Thank you for any help in advance. I am loving Omniboard apart from this issue, which I understand is uncommon.
Issue Analytics
- State:
- Created 4 years ago
- Comments:19 (9 by maintainers)

 Top Related StackOverflow Question
@jfolz After detailed analysis, I figured that most of the rows in your database are missing “info.metrics” which is crucial for Omniboard to aggregate metric columns associated with each run. Only 95 rows have “info.metrics” and all of those 95 rows are correctly displayed with values as expected. You can add a filter in Omniboard
Auto > 0to see that there are 95 rows and query mongodb withand get 95 rows. I don’t know how these rows are missing “info.metrics”, but that is what is causing this issue. You are still able to see metric plots for these runs, because those plots get data from “metrics” collection and they seem to have some data still there.
Sent it just now.