
Lightrun Answers was designed to reduce the constant googling that comes with debugging 3rd party libraries. It collects links to all the places you might be looking at while hunting down a tough bug.
And, if you’re still stuck at the end, we’re happy to hop on a call to see how we can help out.
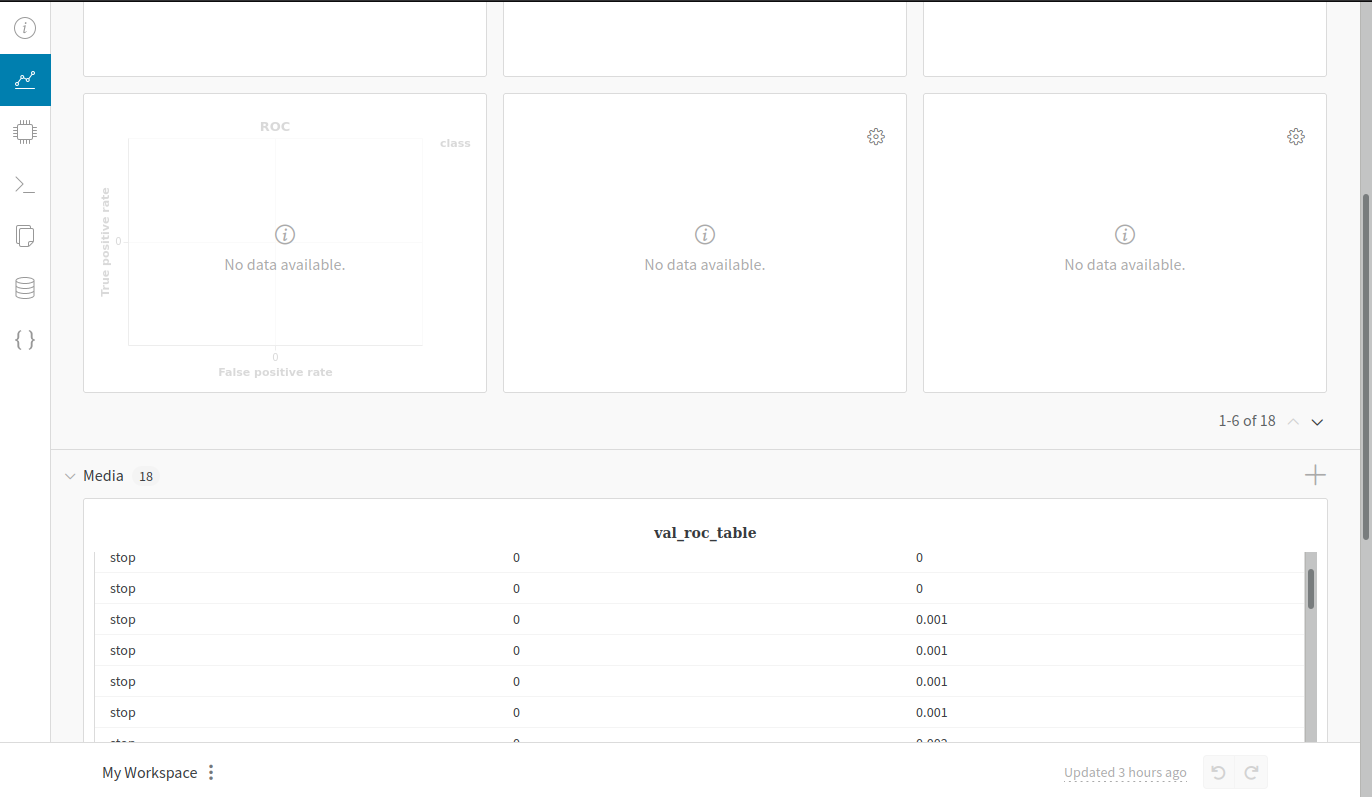
[App] custom charts (eg. Confusion Matrix and ROC) show "no data available"
See original GitHub issueDescribe the bug As of 2 days ago before making this issue, the custom charts I used no longer display data using wandb.log() in the web client.
To Reproduce
The following calls are used from following the docs:
wandb.log({"roc" : wandb.plot.roc_curve(ground_truth, predictions, labels=["a", "b"])})wandb.log({"conf_mat" : wandb.plot.confusion_matrix( probs=None, y_true=ground_truth, preds=predictions, class_names=["a", "b"]})
Using wandb with PyTorch Lightning, but with direct calls from wandb package.
Tables under the ‘Media’ tab are created with values for each custom chart, but not recognized as data to be displayed in ‘Custom Charts’. Instead, custom charts show “no data available”.
This also occurred after logging to a different wandb project ID.
Expected behavior Values to be plotted in the respective custom chart formats, updated after every custom chart log call for the same run.
Issue Analytics
- State:

- Created 2 years ago
- Comments:21 (8 by maintainers)
 Top Related StackOverflow Question
 Troubleshoot Live Code
 Top Related Reddit Thread
 Top Related Hackernoon Post
 Top Related Tweet
 Top Related Dev.to Post
 Top Related Hashnode Post
@IgorHoholko We’ll have a fix in an upcoming release to resolve this issue so you can log automatically again.
@IgorHoholko If you click the edit modal, then modify your query to look as follows: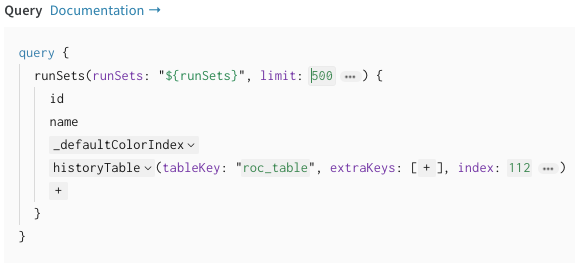 For your ROC chart in this workspace:
https://wandb.ai/ihoholko/masks_attributs?workspace=user-ihoholko
For your ROC chart in this workspace:
https://wandb.ai/ihoholko/masks_attributs?workspace=user-ihoholko
It should work.