
Lightrun Answers was designed to reduce the constant googling that comes with debugging 3rd party libraries. It collects links to all the places you might be looking at while hunting down a tough bug.
And, if you’re still stuck at the end, we’re happy to hop on a call to see how we can help out.
[App]: Default Line Plot sometimes does not show outliers, even without enabled smoothing
See original GitHub issueCurrent Behavior
The Line plot sometimes does not visualize values as it should and skips steps in plots with the same x-axis.
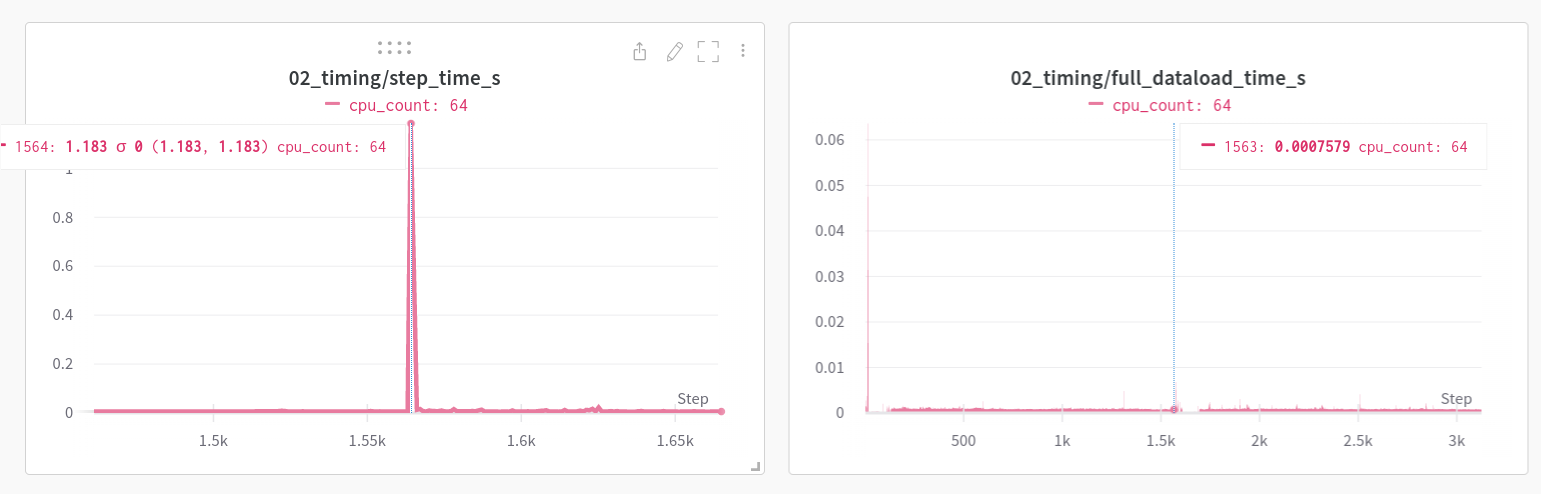
I’m currently analyzing the average step time in seconds and there is a big spike after each epoch starts due to the dataset reshuffling.

The second Line plot tracks the data loading time, but it seems to be there is no spike at step 1564.
When zooming into the step_time_s plot and navigating the step 1564, the value 1.183s pops up, but at the full_dataload_time_s plot the step selected is 1563 with the value 0.0007579s.
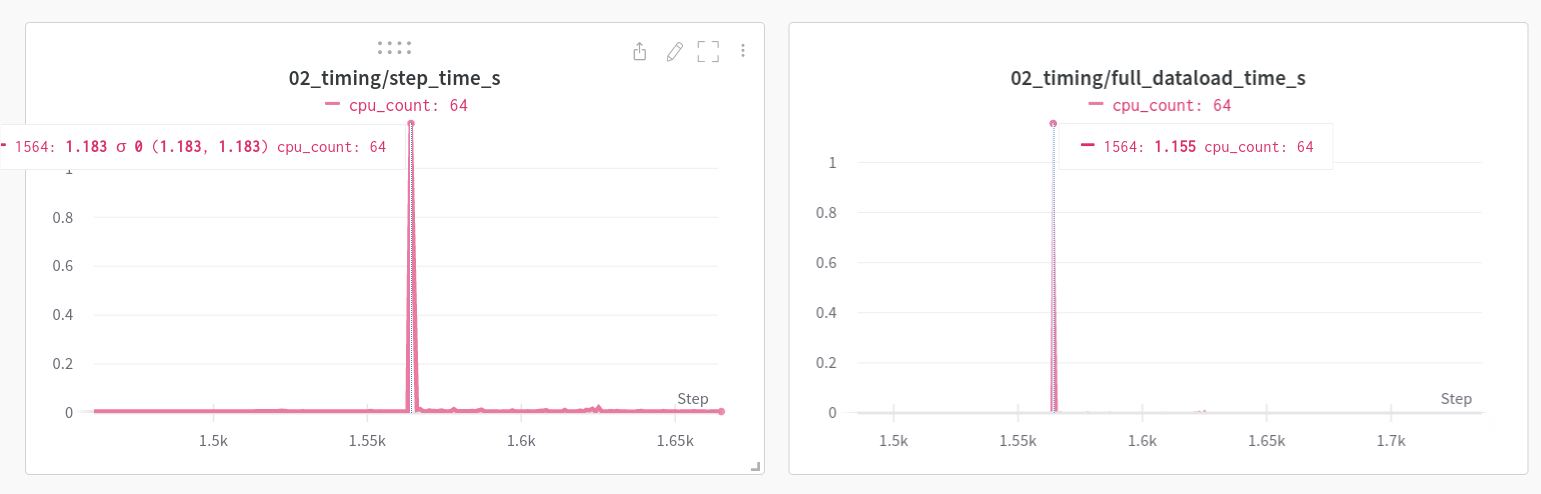
However, when zooming into the target region of step 1564 in the data loading plot, it switches the y-axis and displays the correct spike with the value 1.155s. It also correctly displays the same step 1564.
This happens to all line plots that have a similar frequency, i.e., logging at every step.
Expected Behavior
While it may be impossible to visualize such relatively speaking dense data in a Line plot, I would love to have the value at the same timestep in the tooltip, e.g., it should show the value 1.155s when navigating to step 1564 in the step_time_s plot.
Steps To Reproduce
Code to reproduce. Run with pip3 install -r requirements-cpu.txt; wandb login; python torch10-cifar.py
line-plot-reproduction.zip
Screenshots
No response
Environment
OS: Ubuntu 20.04
Browsers: Brave
Version: Version 1.42.97 Chromium: 104.0.5112.102 (Official Build) (64-bit)
Additional Context
No response
Issue Analytics
- State:

- Created a year ago
- Comments:6
 Top Related StackOverflow Question
 Troubleshoot Live Code
 Top Related Reddit Thread
 Top Related Hackernoon Post
 Top Related Tweet
 Top Related Dev.to Post
 Top Related Hashnode Post
Thanks for the explanation on
Weave. While it looks very powerful, it seems that it is bound by the same 1.5k sampling issue as one-off outliers are sometimes included and sometimes not.I think for now I will just try to minimize the sampling rate to get accurate live plots and zoom into important passages whenever necessary. You can either close this issue or keep it open to close off in the future whenever the dynamic sampling is implemented. Either way, I’m looking forward to the new release 👍
Hi @cirquit thank you for letting me know that you have a workaround for now and sorry that this isn’t currently feasible on our side. We have an internal ticketing system and I will keep this ticket on-hold (here it will remain open) so as to update you once we release a feature to control the sampling points.