
Lightrun Answers was designed to reduce the constant googling that comes with debugging 3rd party libraries. It collects links to all the places you might be looking at while hunting down a tough bug.
And, if you’re still stuck at the end, we’re happy to hop on a call to see how we can help out.
Frontend bug when plotting 3D meshes with `step=`
See original GitHub issuewandb --version && python --version && uname
- Weights and Biases version: 0.8.27
- Python version: 3.7.5
- Operating System: Linux
Description
I am trying to plot 3D models using the code:
wandb.log({prefix + " Mesh %d" % i: wandb.Object3D(open(obj_path))}, step=step)
This worked fine until I added the step= argument (so I could see the evolution of the meshes over time). I’ve checked that the steps are monotonically increasing between calls with the same key and that the keys are what I expect them to be.
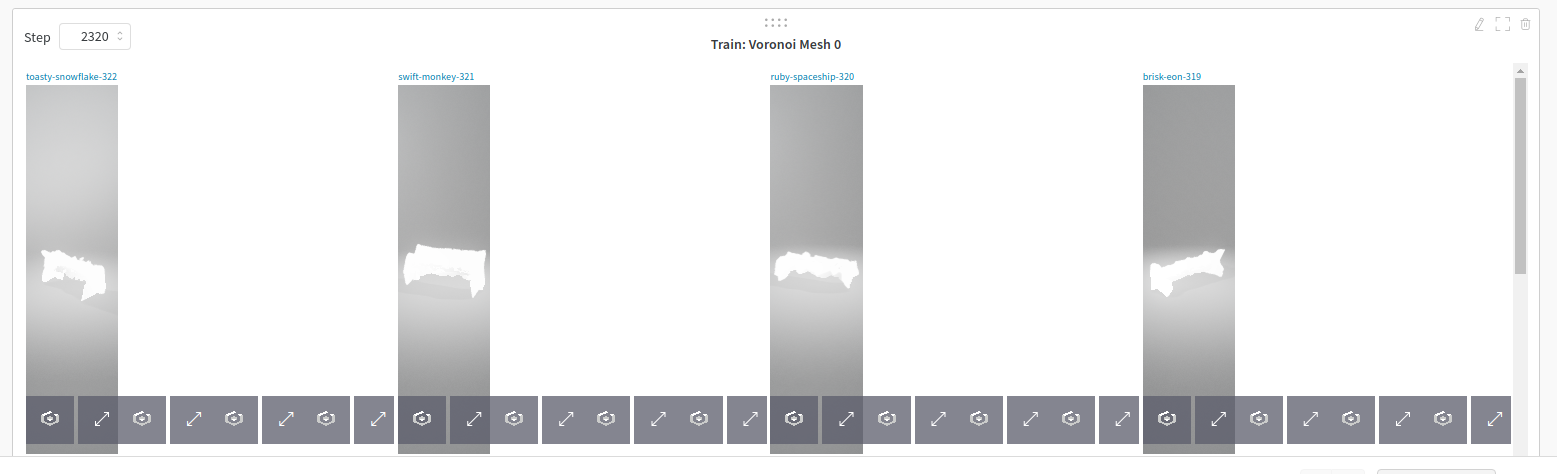
Whenever a new mesh is plotted for a given key, the web UI shows two meshes beside each other and the controls stop working (see screenshot). The problem goes away when refreshing the page.
The screenshot below shows the problem after several new steps have been plotted:
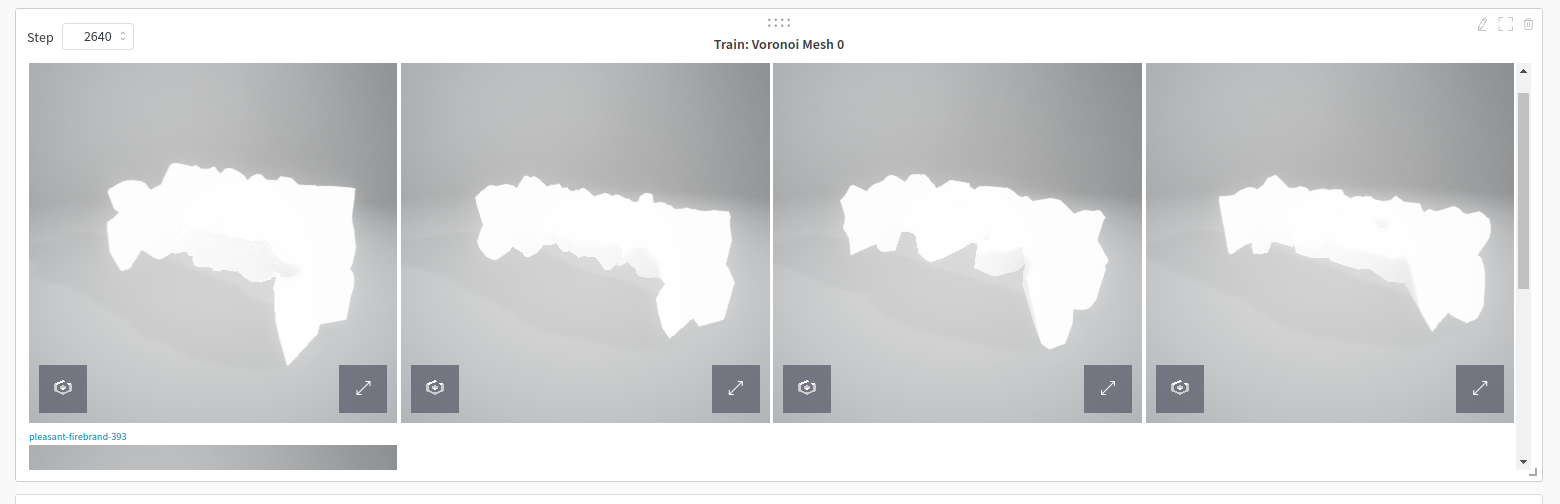
This screenshot shows the same view after refreshing the page (this is what I always expect to see):
Issue Analytics
- State:

- Created 4 years ago
- Comments:12 (5 by maintainers)
 Top Related StackOverflow Question
 Troubleshoot Live Code
 Top Related Reddit Thread
 Top Related Hackernoon Post
 Top Related Tweet
 Top Related Dev.to Post
 Top Related Hashnode Post
Hey @fwilliams In the past year we’ve majorly reworked the CLI and UI for Weights & Biases. We’re closing issues older than 6 months. Please comment to reopen.
The fix will be deployed today. I’ll let you know when it’s live.
Are you interested in writing your own custom shader code? e.g. GLSL. Or something more along the lines of options for controlling lighting position, intensity, type ettc?
Great request, I’ll add this to the roadmap.
We also support passing
StringIOobjects to media files so you can build your obj file in memory.I created a new example of that for you here showing how it works: https://github.com/wandb/client/pull/902/files#diff-503fb3aee8655ce2af95bead1a038319R55
Being able to go straight from tensors as vertices and faces to
objwould great. If you build a helper function to convert tensors to obj. We’d be exciting to merge it into our open source client repo.