
Lightrun Answers was designed to reduce the constant googling that comes with debugging 3rd party libraries. It collects links to all the places you might be looking at while hunting down a tough bug.
And, if you’re still stuck at the end, we’re happy to hop on a call to see how we can help out.
Seeing incredibly bad performance on .NET Core 3.1
See original GitHub issueDescribe the bug The HexEditor control causes very high refresh times in my .NET Core 3.1 app, with up to 500ms for a single refresh increasing with time.
To Reproduce Steps to reproduce the behavior:
- Create a new .NET Core 3.1 WPF application
- Include WpfHexaEditor in your project
- Create the following XAML window:
<Window x:Class="namespace:TestApp.TestWindow"
        xmlns="http://schemas.microsoft.com/winfx/2006/xaml/presentation"
        xmlns:x="http://schemas.microsoft.com/winfx/2006/xaml"
        xmlns:d="http://schemas.microsoft.com/expression/blend/2008"
        xmlns:mc="http://schemas.openxmlformats.org/markup-compatibility/2006"
        xmlns:local="clr-namespace:TestApp"
        xmlns:wpfHexaEditor="clr-namespace:WpfHexaEditor;assembly=WPFHexaEditor"
        mc:Ignorable="d">
    <Grid>
        <StackPanel Margin="5,5,5,5">
            <wpfHexaEditor:HexEditor x:Name="Editor"/>
        </StackPanel>
    </Grid>
</Window>
- Use the following constructor for the window:
			public TestWindow()
        {
            InitializeComponent();

            var stream = new MemoryStream(new byte[] { 0x00, 0x01, 0x02, 0x03, 0x04, 0x05, 0x06, 0x07, 0x08, 0x09 });
            MessageHexEditor.Stream = stream;
        }
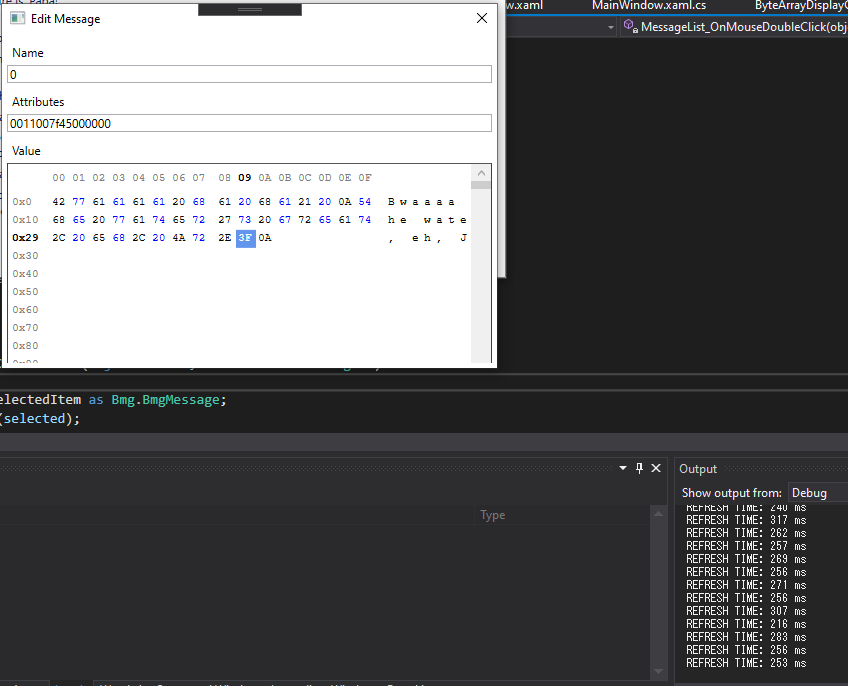
- Observe that the app is very slow, and will progressively get slower with the log showing output like this:
REFRESH TIME: 375 ms
REFRESH TIME: 411 ms
REFRESH TIME: 396 ms
REFRESH TIME: 381 ms
REFRESH TIME: 419 ms
Expected behavior The app should be fast.
Screenshots
When adding a hex edit control, the app is slow and will become unusable.
Desktop (please complete the following information):
- OS: Windows 10 1909
- Framework: .NET Core 3.1
- Package Version: 2.0.2
Is this an issue with my usage of the control? Is .NET Core 3.1 not supported yet?
This issue also occurs on .NET Core 3.0 and in Debug and Release builds.
Issue Analytics
- State:

- Created 3 years ago
- Comments:6 (4 by maintainers)
 Top Related StackOverflow Question
 Troubleshoot Live Code
 Top Related Reddit Thread
 Top Related Hackernoon Post
 Top Related Tweet
 Top Related Dev.to Post
 Top Related Hashnode Post
Can confirm, I added this into a relatively raw application (only one grid and that control next to it) and I my application hangs for about 1+ seconds when I resize or load the file (450kb binary file). Scrolling the view is also quite laggy.
Running on Core 3.1 as well.
To help you a little further, I noticed the following things:
If I got time I might do a profiling session with Visual Studio to analyze the rendering.