
Lightrun Answers was designed to reduce the constant googling that comes with debugging 3rd party libraries. It collects links to all the places you might be looking at while hunting down a tough bug.
And, if you’re still stuck at the end, we’re happy to hop on a call to see how we can help out.
line-and-point legends
See original GitHub issueI need a Line Chart with Points plots and there is an example. It states that altair.Chart(data).mark_line(point=True) will produce line chart with points.
Since I have multiple series to plot I specified color='kind', strokeDash='kind' (or both). I found that the legends are only circles.
- With
color='kind', the circles are filled with the colors. - With
strokeDash='kind', the boundary of the circles are solid or dashed lines.
Without point=True I have lines and the effects are that lines are colored or dashed. With both point=True and {color='kind', strokeDash='kind', or both} I would expect the legends to have both lines and circles, same appearance as plot. I couldn’t figure out how to achieve the desired behavior so that I am opening this issue.
Issue Analytics
- State:

- Created 3 years ago
- Comments:5 (1 by maintainers)
 Top Related StackOverflow Question
 Troubleshoot Live Code
 Top Related Reddit Thread
 Top Related Hackernoon Post
 Top Related Tweet
 Top Related Dev.to Post
 Top Related Hashnode Post
Thanks for providing an example @majiang! Currently it is not possible to combine legends of points and lines, you can follow the discussion here https://github.com/altair-viz/altair/issues/1785 and upstreams in vega-lite here https://github.com/vega/vega-lite/issues/5996
If you append
.resolve_scale(color='independent', strokeDash='independent')to your chart, you can get something like this:The title can be removed from one of the legends by setting
title=''for that encoding channel.Sorry for not being able to try and feedback that time.
I now think it is impossible due to vega-lite’s limitation and describe it with examples.
The desired output was something like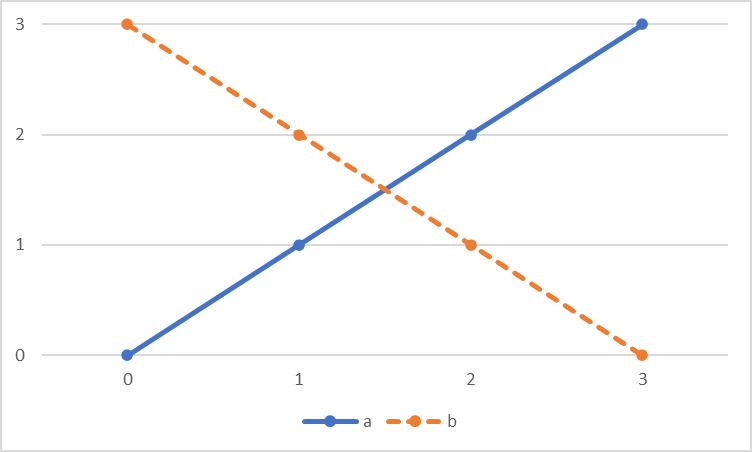
which I created with Excel. By “line-and-point legend” I meant line legend and point legend combined as they look.
With altair, when I opened this issue,
produced
the main part of which was satisfactory, but only legend was not.
I have also tried
which produces similar result:
Here I don’t mind whether the circles are filled or not.
Since the appearance of legend of a
Chartis determined fully automatically by vega-lite from the definition of encoding channels, we can’t produce the desired output.