
Lightrun Answers was designed to reduce the constant googling that comes with debugging 3rd party libraries. It collects links to all the places you might be looking at while hunting down a tough bug.
And, if you’re still stuck at the end, we’re happy to hop on a call to see how we can help out.
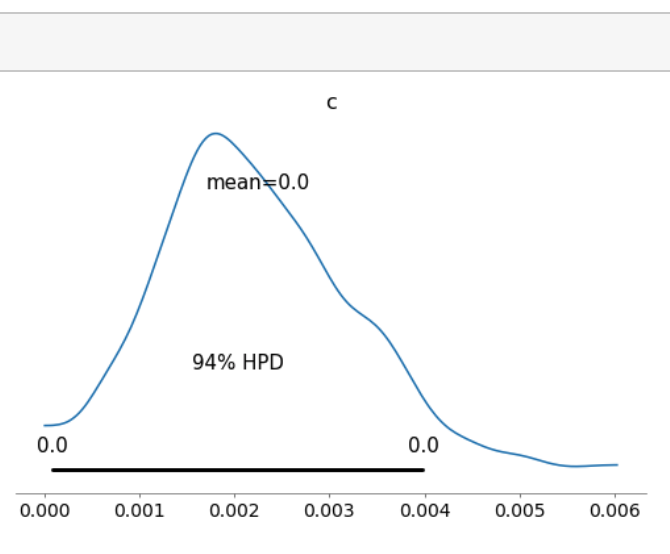
Plot posterior gives anomalous results for small values
See original GitHub issueDescribe the bug I have a model with a small parameter, and on plot posterior the variable is displayed (incorrectly) as having a mean of “0.0” and an HPD between 0.0 and 0.0.
Here’s a snippet of the picture:
To Reproduce
Attached a Jupyter notebook sufficient to reproduce the issue (had to attach it as a .txt file, but should simply be rename-able to run).
Expected behavior Expected the values displayed to be scaled appropriately.
Additional context
arviz version 0.3.3
MacOS Mojave
Issue Analytics
- State:

- Created 4 years ago
- Comments:9 (9 by maintainers)
 Top Related StackOverflow Question
 Troubleshoot Live Code
 Top Related Reddit Thread
 Top Related Hackernoon Post
 Top Related Tweet
 Top Related Dev.to Post
 Top Related Hashnode Post
Should we use significant digits instead of rounding?
What about allowing a custom format string? We could change the
hpd[0].round(round_to)toformat_str.format(hpd[0])ifformat_stringis present, otherwise, the round_to argument would be used. It could also allow the option of using a list instead of a string to use different format for every plot.