
Lightrun Answers was designed to reduce the constant googling that comes with debugging 3rd party libraries. It collects links to all the places you might be looking at while hunting down a tough bug.
And, if you’re still stuck at the end, we’re happy to hop on a call to see how we can help out.
Variable names in element labels for `plot_forest` should be optional
See original GitHub issueCurrently, creating a forest plot with plot_forest uses <var name> <coordinate name> as the scheme for labels on the y-axis. This creates a slew of repeated variable names in the labels, which I would guess is almost always undesirable (particularly when you have nice element labels as coordinates in the dataset):
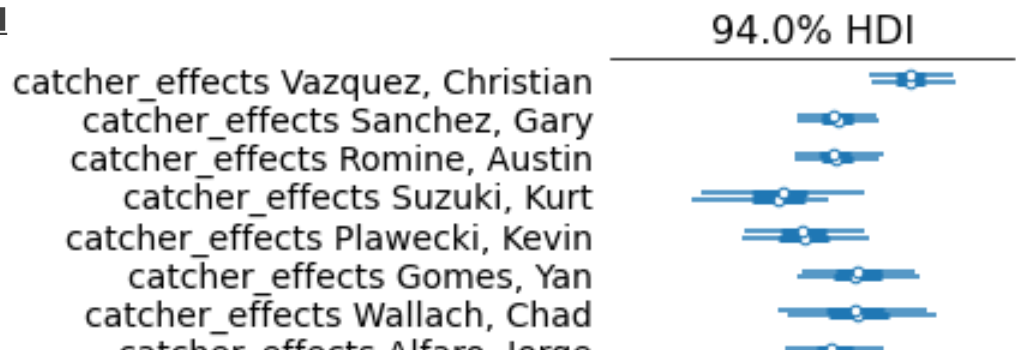
There should be excluded by default, and turned on with a include_var_names=True (or similar) argument.
Alternatively, the first coordinate could include the variable name, and then exclude it for subsequent ones.
Issue Analytics
- State:

- Created 3 years ago
- Reactions:1
- Comments:5 (5 by maintainers)
 Top Related StackOverflow Question
 Troubleshoot Live Code
 Top Related Reddit Thread
 Top Related Hackernoon Post
 Top Related Tweet
 Top Related Dev.to Post
 Top Related Hashnode Post
… and in Bokeh
How about something like this (using the
mpl_plot_forest_ridgeexample):here is the current behavior:
Got a PR ready to go if this works for everyone.