
Stuck on an issue?
Lightrun Answers was designed to reduce the constant googling that comes with debugging 3rd party libraries. It collects links to all the places you might be looking at while hunting down a tough bug.
And, if you’re still stuck at the end, we’re happy to hop on a call to see how we can help out.
Add to documentation: How to plot unfilled polygons onto another map
See original GitHub issueIt was really hard for me to find out that the facecolor of a plot has to be 'none' instead of None to plot an unfilled polygon. I needed it to plot two tables into one figure (see below).
We could add an information to the API-documentation:
**style_kwds : dict
    Color options to be passed on to the actual plot function, such as edgecolor, facecolor,
-   linewidth, markersize, alpha.
+   linewidth, markersize, alpha. Use 'facecolor='none' to get an unfilled polygon.
Or we could add an example to the “Making maps” section.
What do you think?
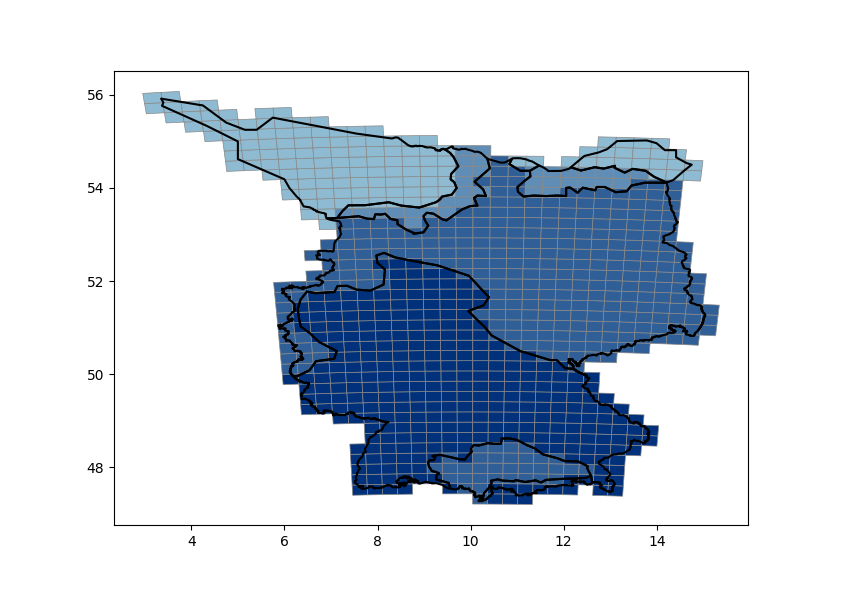
ax = df1.plot(column='windzone', edgecolor='#888888', linewidth=0.5, cmap=my_blue)
df2.plot(edgecolor='black', alpha=1, facecolor='none', ax=ax, linewidth=1.5)
plt.show()
Issue Analytics
- State:

- Created 5 years ago
- Comments:7 (5 by maintainers)
 Top Results From Across the Web
Mapping and Plotting Tools - GeoPandas
Simply use the plot command with the column argument set to the column whose values you want used to assign colors.
Read more >Add a polygon layer to a map - Azure - Microsoft Learn
Load an image pattern into the maps image sprite resources and then reference this image with the fillPattern property of the polygon layer....
Read more >Plot Reference — geoplot 0.5.0 documentation - GitHub Pages
The polyplot draws polygons on a map. ... In this plot we also add a backing outline of the original state shapes, for...
Read more >Plot one or more filled polygonal regions - MATLAB patch
This MATLAB function plots one or more filled polygonal regions using the elements of X and Y as the coordinates for each vertex....
Read more >Create points on a map—ArcGIS Pro | Documentation
In this tutorial, you will create a geodatabase feature class in a project, add metadata, add fields to the attribute table, and start...
Read more > Top Related Medium Post
No results found
 Top Related StackOverflow Question
No results found
 Troubleshoot Live Code
Lightrun enables developers to add logs, metrics and snapshots to live code - no restarts or redeploys required.
Start Free Top Related Reddit Thread
No results found
 Top Related Hackernoon Post
No results found
 Top Related Tweet
No results found
 Top Related Dev.to Post
No results found
 Top Related Hashnode Post
No results found
@uvchik @jorisvandenbossche Hi, I’d like to take on this issue!
The fact that
facecolor='none'is so in the weeds is why I prefer doingworld.boundary.plot(). I find that to be both more explicit and clear, but I’m not sure if there’s a performance penalty for it.