
Lightrun Answers was designed to reduce the constant googling that comes with debugging 3rd party libraries. It collects links to all the places you might be looking at while hunting down a tough bug.
And, if you’re still stuck at the end, we’re happy to hop on a call to see how we can help out.
Blender experiencing short hangs when Prorender is enabled in viewport or when rendering, debug stuff inside.
See original GitHub issueAloha, thought it was just my hardware being ancient and taking a minute when starting viewport/render but have debug stuff might be relevant. This actually may be an issue with Intels/Microsofts side of the fence Check the end of this for output from Blender in visual studio output window regarding RIF API, nodes, and other shenanigans that are probably really important.
 The minidump .dmp file is 9 gigs large,
Edit: That 8GB of RAM in use by Blender was on top of 8GB vram, without moving the viewport and with a default cube with a RPR material, but it looked weird.
- System, R9 390 8GB - Ryzen 7 1800X, Win 10 19045 - Blender 3.3 and Blender 3.4
- No .blend necessary, default start-up blend cube untouched used.
- It still works, mostly. The effect is Blender choking up and Windows wanting to take it out behind a barn and shoot it instead of giving it a minute.
- GPU Rendering but also CPU Cycles after RPR has been used I tried rolling back my drivers using DDU in safemode, I normally use 22.10.1 that’s been tweaked to chooch on GCN arch to shut Substance Painter up, no change with completely ripping it out and using the legacy driver. I tried getting exceptions thrown in other applications but wasn’t successful.
RPR use causes short hangs, kinda slows things down, seems to kick Cycle and Eevee in the bum after its been used as they are fine before it. Things do end up working which is kind of awesome on the whole exception handling front but things are also not working right. Switching viewport to Material Preview or Rendered mode or rendering with F12 causes hangs that resolve but kinda suck. This behavior persists until Blender is restarted and does not come into play until RPR is used. If RPR is not used Eevee and Cycles are unaffected.
This is EEVEE and then Cycles rendering the default cube via F12, debug breakpoints mark the start of each. They render fully with no exceptions until switched to RPR, after that they don’t perform properly until restarting Blender. Not all of this debugging stuff is from the same instance.
Here is RPR and EEVEE/Cycles post RPR
Various access violations surrounding tbbmalloc.dll in various situations, repeatable and not RPR specific after switching renderer but worst with RPR, during full rendering the output of access violations is nearly nonstop, RPR also spews them when moving the viewport and it re-rendering
Call stack when first exception kicked. I can switch to the render pane in Blender with no viewport shown, switch to RPR and nothing will occur, switching back to the layout pane in Blender where RPR needs to render begins the problems.
Here is the code map from this event. VS Code Map
In the callstack DXCore and related items looking at the adapter all go back to the same assembly operation,
 00007FFF19F291CE nop - msvcp_win.dll!std::time_put<char,std::ostreambuf_iterator<char,std::char_traits<char>>>::`vector deleting destructor'()
00007FFF19F2959A nop > msvcp_win.dll!std::locale::_Locimp::`vector deleting destructor'()
00007FFF1101BE40 nop > DXCore.dll!DXCoreAdapter::QueryAndFillAdapterExtendedProperiesOnPlatform(void)
00007FFF11019C24 nop > DXCore.dll!DXCoreAdapterFactory::UpdateAdapterEnumerationMapOnPlatform(bool)
00007FFF19F291CE nop - msvcp_win.dll!std::time_put<char,std::ostreambuf_iterator<char,std::char_traits<char>>>::`vector deleting destructor'()
00007FFF19F2959A nop > msvcp_win.dll!std::locale::_Locimp::`vector deleting destructor'()
00007FFF1101BE40 nop > DXCore.dll!DXCoreAdapter::QueryAndFillAdapterExtendedProperiesOnPlatform(void)
00007FFF11019C24 nop > DXCore.dll!DXCoreAdapterFactory::UpdateAdapterEnumerationMapOnPlatform(bool)
DX12 DXCore having issues and then access violations
> tbbmalloc.dll!00007ffe7c1499d1() Unknown No symbols loaded.
tbbmalloc.dll!00007ffe7c14845e() Unknown No symbols loaded.
tbbmalloc.dll!00007ffe7c149cb6() Unknown No symbols loaded.
msvcp_win.dll!std::time_put<char,std::ostreambuf_iterator<char,std::char_traits<char>>>::`vector deleting destructor'() Unknown Symbols loaded.
msvcp_win.dll!std::locale::_Locimp::`vector deleting destructor'() Unknown Symbols loaded.
DXCore.dll!DXCoreAdapter::QueryAndFillAdapterExtendedProperiesOnPlatform(void) Unknown Symbols loaded.
DXCore.dll!DXCoreAdapterFactory::AddUpdateAdapterInMap(bool,unsigned int,struct _LUID const &,struct DXCORE_INTERNAL_ADAPTER_PROPERTIES *,enum DXCORE_INTERNAL_ADAPTER_FLAGS *,struct DXCoreHardwareID *) Unknown Symbols loaded.
DXCore.dll!DXCoreAdapterFactory::UpdateAdapterEnumerationMapOnPlatform(bool) Unknown Symbols loaded.
DXCore.dll!DXCoreAdapterFactory::RuntimeClassInitialize(void) Unknown Symbols loaded.
DXCore.dll!MakeAndInitialize<class DXCoreAdapterFactory,class DXCoreAdapterFactory>(class DXCoreAdapterFactory * *) Unknown Symbols loaded.
DXCore.dll!DXCoreCreateAdapterFactory
() Unknown Symbols loaded.
D3D12Core.dll!CCreateDeviceCache::SelectAdapter(struct IUnknown *) Unknown Symbols loaded.
D3D12Core.dll!D3D12CoreCreateDevice
() Unknown Symbols loaded.
D3D12Core.dll!D3D12ValidateAndCreateDevice
() Unknown Symbols loaded.
D3D12.dll!D3D12CreateDeviceImpl(struct IUnknown *,enum D3D_FEATURE_LEVEL,struct _GUID const &,void * *) Unknown Symbols loaded.
D3D12.dll!D3D12CreateDevice
() Unknown Symbols loaded.
RadeonImageFilters.dll!00007ffe6d8c2a54() Unknown No symbols loaded.
RadeonImageFilters.dll!00007ffe6d8bbdf6() Unknown No symbols loaded.
RadeonImageFilters.dll!00007ffe6d7ce03b() Unknown No symbols loaded.
RadeonImageFilters.dll!00007ffe6d7ca8c8() Unknown No symbols loaded.
RadeonImageFilters.dll!00007ffe6d7ca47c() Unknown No symbols loaded.
RadeonImageFilters.dll!00007ffe6d7fa0dc() Unknown No symbols loaded.
RadeonImageFilters.dll!00007ffe6d7daba3() Unknown No symbols loaded.
RadeonImageFilters.dll!00007ffe6d86ee21() Unknown No symbols loaded.
__imagefilters.cp310-win_amd64.pyd!00007ffe6d7aacd0() Unknown No symbols loaded.
python310.dll!00007ffe71d30b48() Unknown No symbols loaded.
python310.dll!00007ffe71ceb7f8() Unknown No symbols loaded.
python310.dll!00007ffe71e00a92() Unknown No symbols loaded.
python310.dll!00007ffe71dfcddd() Unknown No symbols loaded.
python310.dll!00007ffe71dff16f() Unknown No symbols loaded.
python310.dll!00007ffe71cebbae() Unknown No symbols loaded.
python310.dll!00007ffe71e00c92() Unknown No symbols loaded.
python310.dll!00007ffe71dfbbf0() Unknown No symbols loaded.
python310.dll!00007ffe71dff16f() Unknown No symbols loaded.
python310.dll!00007ffe71cebbae() Unknown No symbols loaded.
python310.dll!00007ffe71df8521() Unknown No symbols loaded.
python310.dll!00007ffe71e00a92() Unknown No symbols loaded.
python310.dll!00007ffe71dfc84d() Unknown No symbols loaded.
python310.dll!00007ffe71dff16f() Unknown No symbols loaded.
python310.dll!00007ffe71cebbae() Unknown No symbols loaded.
python310.dll!00007ffe71ceb604() Unknown No symbols loaded.
python310.dll!00007ffe71cebe22() Unknown No symbols loaded.
python310.dll!00007ffe71d5a0cd() Unknown No symbols loaded.
python310.dll!00007ffe71d4da1e() Unknown No symbols loaded.
python310.dll!00007ffe71ceb7f8() Unknown No symbols loaded.
python310.dll!00007ffe71e00a92() Unknown No symbols loaded.
python310.dll!00007ffe71dfc84d() Unknown No symbols loaded.
python310.dll!00007ffe71dff16f() Unknown No symbols loaded.
python310.dll!00007ffe71cebbae() Unknown No symbols loaded.
python310.dll!00007ffe71df8521() Unknown No symbols loaded.
python310.dll!00007ffe71e00a92() Unknown No symbols loaded.
python310.dll!00007ffe71dfcdf3() Unknown No symbols loaded.
python310.dll!00007ffe71dff16f() Unknown No symbols loaded.
python310.dll!00007ffe71cebbae() Unknown No symbols loaded.
python310.dll!00007ffe71df8521() Unknown No symbols loaded.
python310.dll!00007ffe71e00a92() Unknown No symbols loaded.
python310.dll!00007ffe71dfcdf3() Unknown No symbols loaded.
python310.dll!00007ffe71dff16f() Unknown No symbols loaded.
python310.dll!00007ffe71cebbae() Unknown No symbols loaded.
python310.dll!00007ffe71ceb604() Unknown No symbols loaded.
python310.dll!00007ffe71cebe22() Unknown No symbols loaded.
python310.dll!00007ffe71d5a0cd() Unknown No symbols loaded.
python310.dll!00007ffe71d4da1e() Unknown No symbols loaded.
python310.dll!00007ffe71ceb7f8() Unknown No symbols loaded.
python310.dll!00007ffe71e00a92() Unknown No symbols loaded.
python310.dll!00007ffe71dfcddd() Unknown No symbols loaded.
python310.dll!00007ffe71dff16f() Unknown No symbols loaded.
python310.dll!00007ffe71cebbae() Unknown No symbols loaded.
python310.dll!00007ffe71df8521() Unknown No symbols loaded.
python310.dll!00007ffe71e00a92() Unknown No symbols loaded.
python310.dll!00007ffe71dfcdf3() Unknown No symbols loaded.
python310.dll!00007ffe71dff16f() Unknown No symbols loaded.
python310.dll!00007ffe71cebbae() Unknown No symbols loaded.
python310.dll!00007ffe71df8521() Unknown No symbols loaded.
python310.dll!00007ffe71e00a92() Unknown No symbols loaded.
python310.dll!00007ffe71dfcdf3() Unknown No symbols loaded.
python310.dll!00007ffe71dff16f() Unknown No symbols loaded.
python310.dll!00007ffe71cebbae() Unknown No symbols loaded.
python310.dll!00007ffe71cede91() Unknown No symbols loaded.
python310.dll!00007ffe71cee03d() Unknown No symbols loaded.
python310.dll!00007ffe71df8521() Unknown No symbols loaded.
python310.dll!00007ffe71e00a92() Unknown No symbols loaded.
python310.dll!00007ffe71dfcddd() Unknown No symbols loaded.
python310.dll!00007ffe71dff16f() Unknown No symbols loaded.
python310.dll!00007ffe71cebbae() Unknown No symbols loaded.
python310.dll!00007ffe71df8521() Unknown No symbols loaded.
python310.dll!00007ffe71e00a92() Unknown No symbols loaded.
python310.dll!00007ffe71dfcdf3() Unknown No symbols loaded.
python310.dll!00007ffe71dff16f() Unknown No symbols loaded.
python310.dll!00007ffe71cebbae() Unknown No symbols loaded.
blender.exe!00007ff724ef6477() Unknown No symbols loaded.
blender.exe!00007ff724ed491c() Unknown No symbols loaded.
blender.exe!00007ff724c8db62() Unknown No symbols loaded.
blender.exe!00007ff724c8d9a2() Unknown No symbols loaded.
blender.exe!00007ff724c44c8c() Unknown No symbols loaded.
blender.exe!00007ff724c415fe() Unknown No symbols loaded.
blender.exe!00007ff724c42659() Unknown No symbols loaded.
blender.exe!00007ff7257990d0() Unknown No symbols loaded.
blender.exe!00007ff724f179cd() Unknown No symbols loaded.
blender.exe!00007ff724b3fb37() Unknown No symbols loaded.
blender.exe!00007ff724b3f4e3() Unknown No symbols loaded.
blender.exe!00007ff724b3efa2() Unknown No symbols loaded.
blender.exe!00007ff724b17df0() Unknown No symbols loaded.
blender.exe!00007ff723be8439() Unknown No symbols loaded.
blender.exe!00007ff72a71a8cc() Unknown No symbols loaded.
kernel32.dll!BaseThreadInitThunk
() Unknown Symbols loaded.
ntdll.dll!RtlUserThreadStart
() Unknown Symbols loaded.
RPR as renderer, switching from solid to mat preview
Exception thrown at 0x00007FFEFBBF99D1 (tbbmalloc.dll) in blender.exe: 0xC0000005: Access violation reading location 0x0000021940D4006C.
Exception thrown at 0x00007FFE7DB299D1 (tbbmalloc.dll) in blender.exe: 0xC0000005: Access violation reading location 0x0000012CE3C0806C.
Exception thrown at 0x00007FFEFC4F99D1 (tbbmalloc.dll) in blender.exe: 0xC0000005: Access violation reading location 0x0000016337E8406C.
Restarted Blender, same triggerable issue included some assembly here
Exception thrown at 0x00007FFEFBBF99D1 (tbbmalloc.dll) in blender.exe: 0xC0000005: Access violation reading location 0x0000021940D4006C.

00007FFEFBBF9CB6  test        al,al
00007FFEFBBF99D1  mov         rax,qword ptr [rdx]
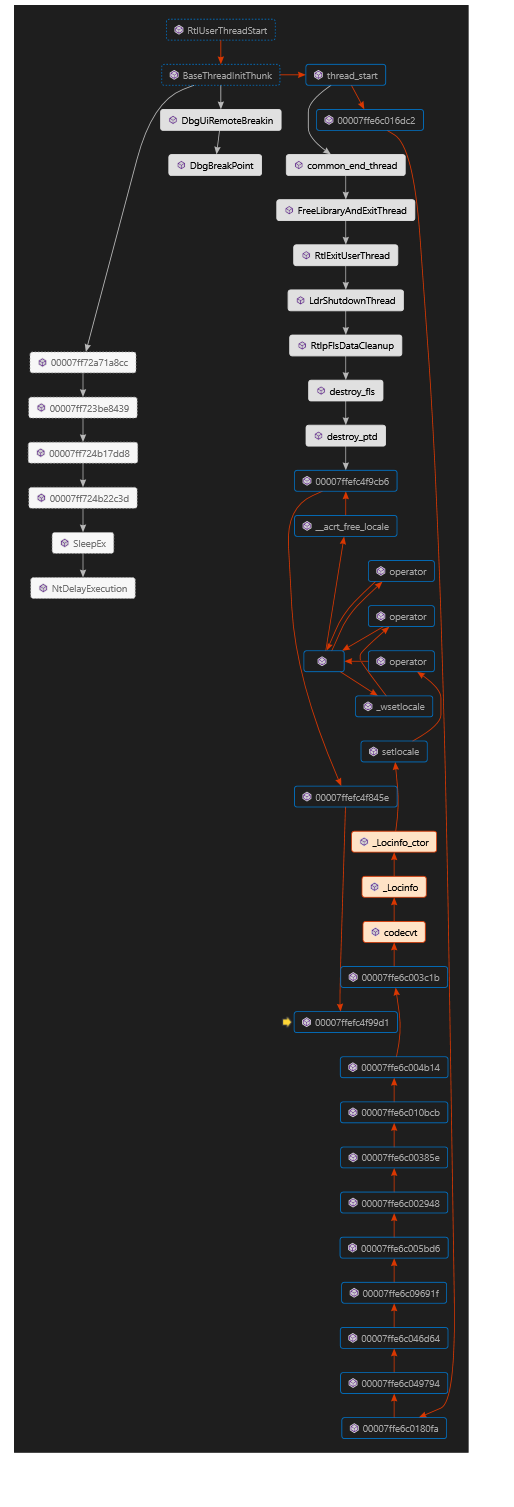
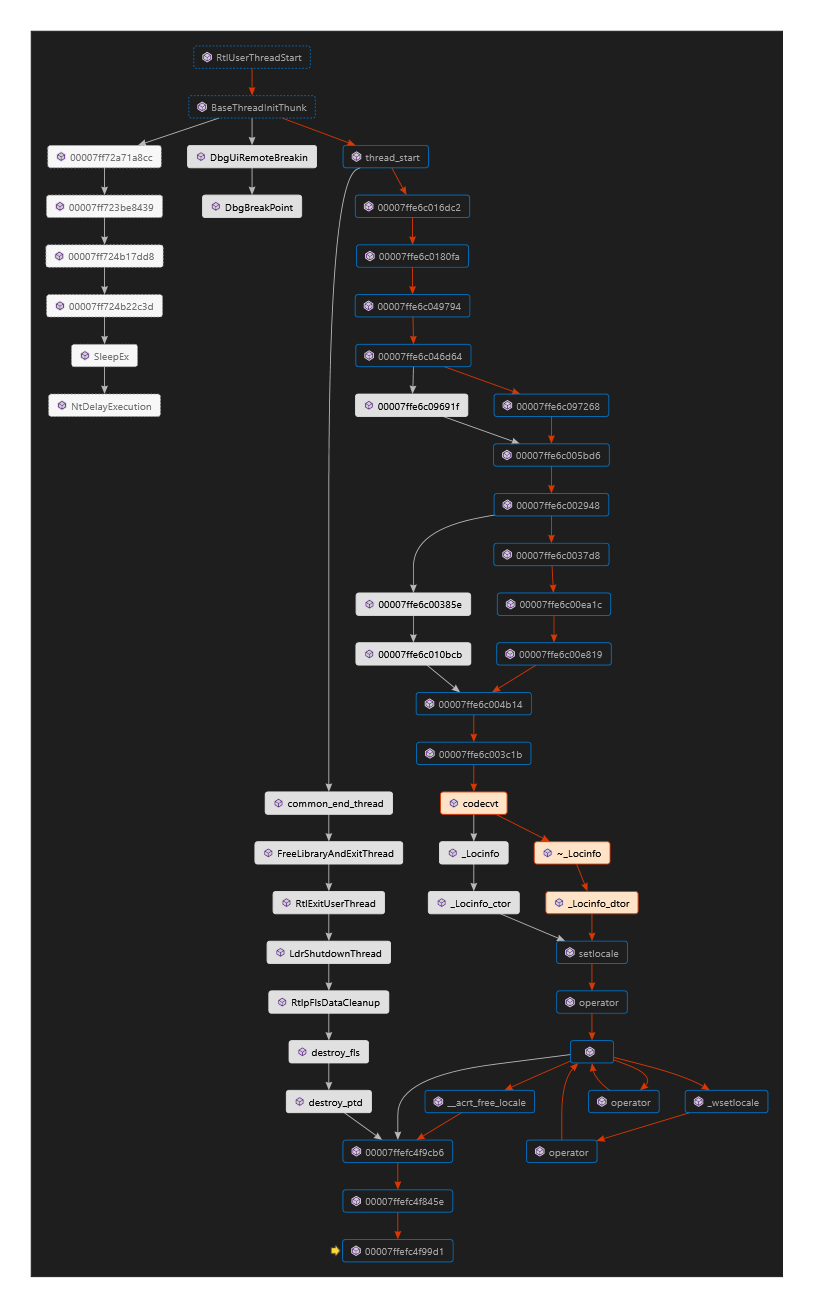
Some call stack fun, occuring during RPR rendering
ucrtbase.dll!__acrt_free_locale
() Unknown Symbols loaded.
ucrtbase.dll!<lambda>(void)() Unknown Symbols loaded.
ucrtbase.dll!__crt_seh_guarded_call<void>::operator()<<lambda_1d892b297fdedeee07ed8124eeb2f2fa>,<lambda>(void) &,<lambda_01a7098693036236037e7cdb9bca3d73>>() Unknown Symbols loaded.
ucrtbase.dll!<lambda>(void)() Unknown Symbols loaded.
ucrtbase.dll!__crt_seh_guarded_call<void>::operator()<<lambda_e9338f07fe435327d97d4ef86149e64d>,<lambda>(void) &,<lambda_02db5278e8aef8b5e4976579d73f5304> &>() Unknown Symbols loaded.
ucrtbase.dll!_wsetlocale() Unknown Symbols loaded.
ucrtbase.dll!<lambda>(void)() Unknown Symbols loaded.
ucrtbase.dll!__crt_seh_guarded_call<char *>::operator()<<lambda_e9ce07acdb0b138e546925ae9f1a2c9c>,<lambda>(void) &,<lambda_5d037afbfc54bf1ca80d3d1ee4062886>>() Unknown Symbols loaded.
ucrtbase.dll!setlocale
() Unknown Symbols loaded.
msvcp140.dll!std::_Locinfo::_Locinfo_ctor(std::_Locinfo * pLocinfo, const char * locname) Line 203 C++ Symbols loaded.
msvcp140.dll!std::_Locinfo::_Locinfo(const char * _Pch) Line 157 C++ Symbols loaded.
msvcp140.dll!std::codecvt<wchar_t,char,_Mbstatet>::codecvt<wchar_t,char,_Mbstatet>(unsigned __int64 _Refs) Line 1962 C++ Symbols loaded.
ucrtbase.dll!<lambda>(void)() Unknown Symbols loaded.
ucrtbase.dll!__crt_seh_guarded_call<char *>::operator()<<lambda_e9ce07acdb0b138e546925ae9f1a2c9c>,<lambda>(void) &,<lambda_5d037afbfc54bf1ca80d3d1ee4062886>>() Unknown Symbols loaded.
ucrtbase.dll!setlocale
() Unknown Symbols loaded.
msvcp140.dll!std::_Locinfo::_Locinfo_dtor(std::_Locinfo * pLocinfo) Line 213 C++ Symbols loaded.
msvcp140.dll!std::_Locinfo::~_Locinfo() Line 180 C++ Symbols loaded.
msvcp140.dll!std::codecvt<wchar_t,char,_Mbstatet>::codecvt<wchar_t,char,_Mbstatet>(unsigned __int64 _Refs) Line 1963 C++ Symbols loaded.
Further call stack
ucrtbase.dll!<lambda>(void)() Unknown Symbols loaded.
ucrtbase.dll!__crt_seh_guarded_call<int>::operator()<<lambda_7777bce6b2f8c936911f934f8298dc43>,<lambda>(void) &,<lambda_3883c3dff614d5e0c5f61bb1ac94921c>>() Unknown Symbols loaded.
ucrtbase.dll!_execute_onexit_table
() Unknown Symbols loaded.
ucrtbase.dll!__crt_state_management::wrapped_invoke<int ,int *,int>(int ,int *) Unknown Symbols loaded.
dxilconv.dll!dllmain_crt_process_detach() Unknown Symbols loaded.
dxilconv.dll!dllmain_dispatch() Unknown Symbols loaded.
ntdll.dll!LdrpCallInitRoutine() Unknown Symbols loaded.
ntdll.dll!LdrpProcessDetachNode() Unknown Symbols loaded.
ntdll.dll!LdrpUnloadNode() Unknown Symbols loaded.
ntdll.dll!LdrpDecrementModuleLoadCountEx
() Unknown Symbols loaded.
ntdll.dll!LdrUnloadDll
() Unknown Symbols loaded.
KernelBase.dll!FreeLibrary() Unknown Symbols loaded.
D3D12Core.dll!CDevice::CreateDefaults(void) Unknown Symbols loaded.
D3D12Core.dll!CDevice::LLOCompleteLayerConstruction(void) Unknown Symbols loaded.
D3D12Core.dll!NDXGI::CDevice::LLOCompleteLayerConstruction(void) Unknown Symbols loaded.
D3D12.dll!NOutermost::CDevice::FinalConstruct(struct NOutermost::CDevice::TConstructorArgs const &) Unknown Symbols loaded.
D3D12.dll!TComObject<NOutermost::CDevice>::TComObject<NOutermost::CDevice>() Unknown Symbols loaded.
D3D12.dll!D3D12CreateLayeredDevice(unsigned int,void const *,unsigned __int64,struct ID3D12LayeredDevice *,struct _GUID const &,void * *) Unknown Symbols loaded.
D3D12Core.dll!D3D12CoreCreateLayeredDevice
() Unknown Symbols loaded.
D3D12Core.dll!D3D12CoreCreateDevice
() Unknown Symbols loaded.
D3D12Core.dll!D3D12ValidateAndCreateDevice
() Unknown Symbols loaded.
D3D12.dll!D3D12CreateDeviceImpl(struct IUnknown *,enum D3D_FEATURE_LEVEL,struct _GUID const &,void * *) Unknown Symbols loaded.
D3D12.dll!D3D12CreateDevice
() Unknown Symbols loaded.
Switching from RPR to EEVEE while Viewport in Rendered
EEVEE
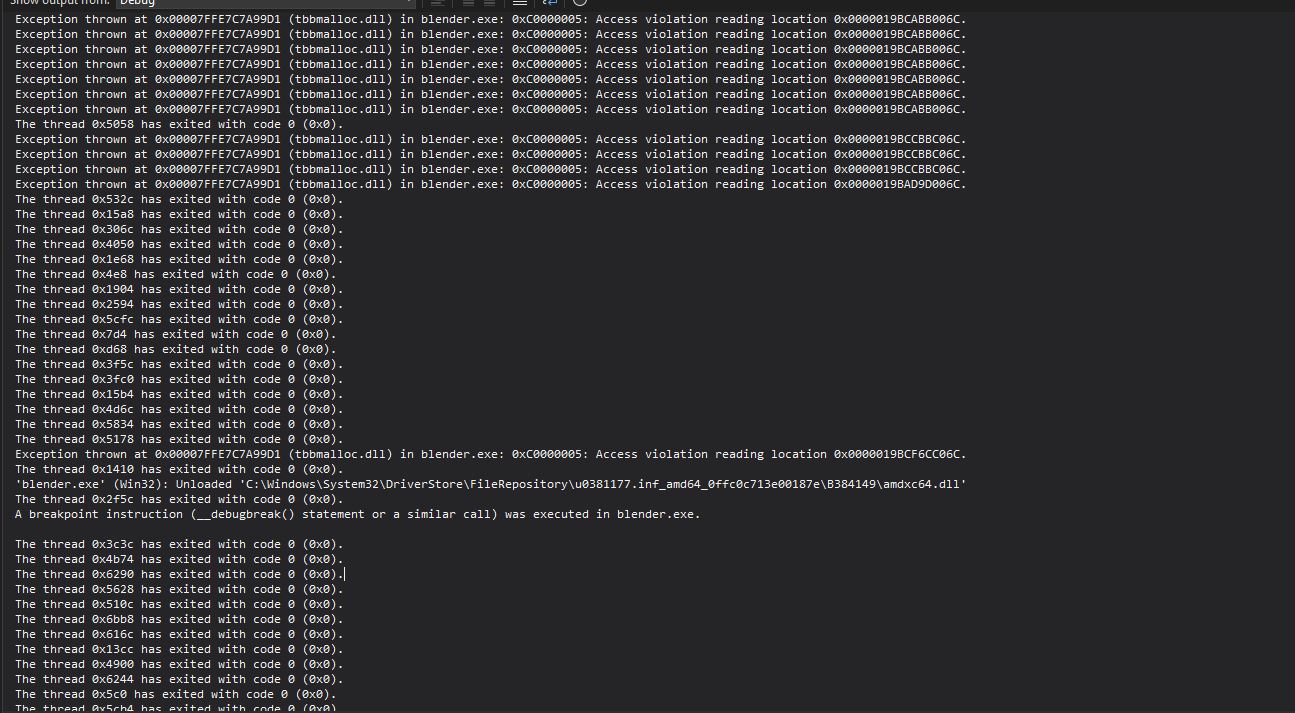
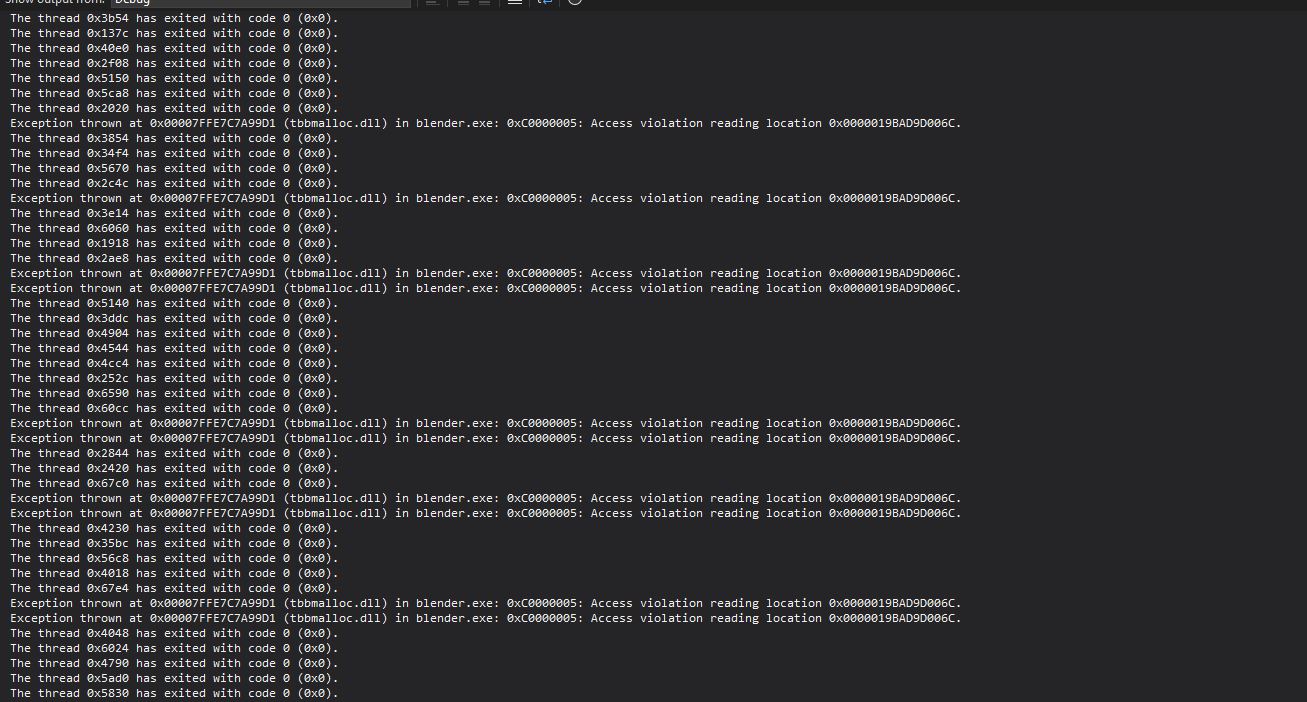
Exception thrown at 0x00007FFE7C7A99D1 (tbbmalloc.dll) in blender.exe: 0xC0000005: Access violation reading location 0x0000019BAD9D006C.
No exception switching to Cycles from EEVEE but exception thrown when lowering VP to Solid from Render
Exception thrown at 0x00007FFE7C7A99D1 (tbbmalloc.dll) in blender.exe: 0xC0000005: Access violation reading location 0x0000019BCCBBC06C.
Same exception while unloading OpenCL
'blender.exe' (Win32): Unloaded 'C:\Windows\System32\OpenCL.dll'
Exception thrown at 0x00007FFEFC4F99D1 (tbbmalloc.dll) in blender.exe: 0xC0000005: Access violation reading location 0x0000016337E8406C.
This happened, but it was while Blender was starting up. Might not be relevant.
Error: Required device extension VK_KHR_deferred_host_operations is not supported.
blender.exe' (Win32): Loaded 'C:\Windows\System32\amdihk64.dll'. Module was built without symbols.
Error: Required device extension VK_KHR_deferred_host_operations is not supported.
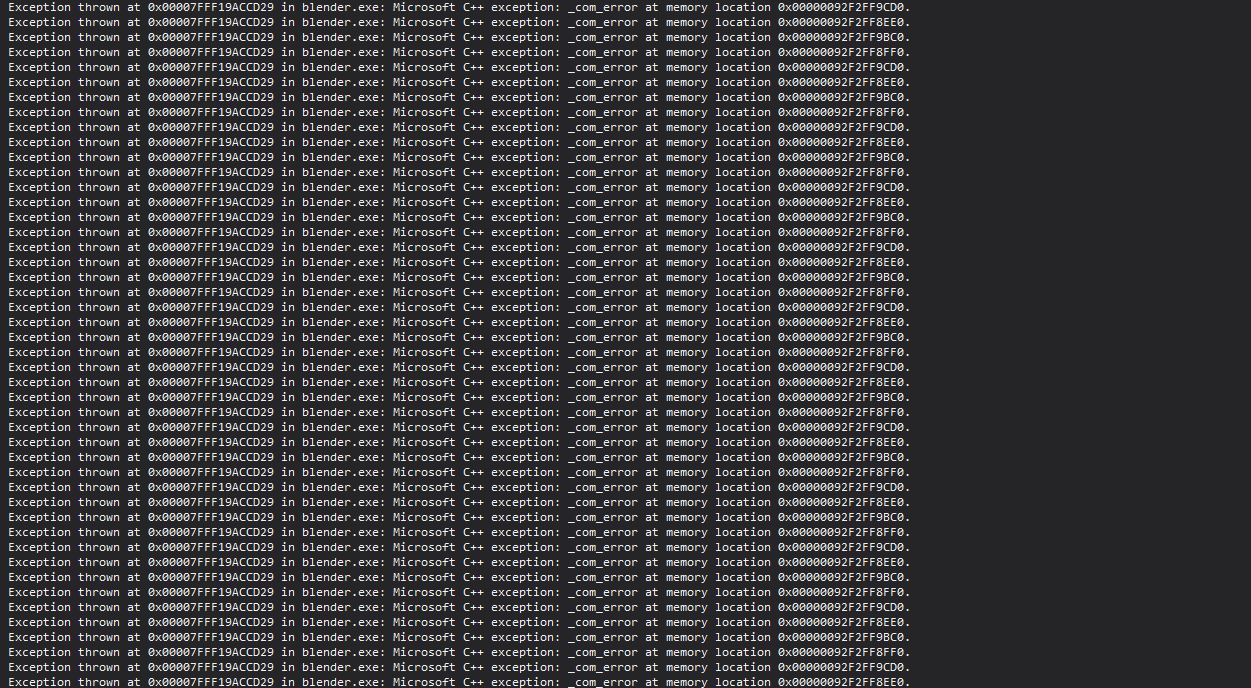
Exception thrown at 0x00007FFF19ACCD29 in blender.exe: Microsoft C++ exception: std::runtime_error at memory location 0x00000092E05F7630.
Exception thrown at 0x00007FFF19ACCD29 in blender.exe: Microsoft C++ exception: FrException at memory location 0x00000092E05F8B50.
Exception thrown at 0x00007FFF19ACCD29 in blender.exe: Microsoft C++ exception: [rethrow] at memory location 0x0000000000000000.
Exception thrown at 0x00007FFF19ACCD29 in blender.exe: Microsoft C++ exception: FrException at memory location 0x00000092E05F8B50.
Exception thrown at 0x00007FFF19ACCD29 in blender.exe: Microsoft C++ exception: [rethrow] at memory location 0x0000000000000000.
Exception thrown at 0x00007FFF19ACCD29 in blender.exe: Microsoft C++ exception: FrException at memory location 0x00000092E05F8B50.
Visual Studio output in pictures
VS when RPR is rendering.
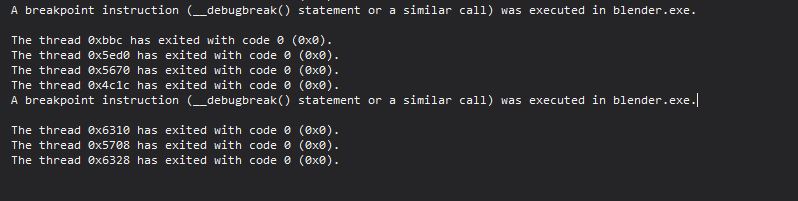
VS again, start of new renders marked by blenders debugbreak
More of just the same, this is RPR dependent Cycles and EEVEE do not do this during F12 rendering.
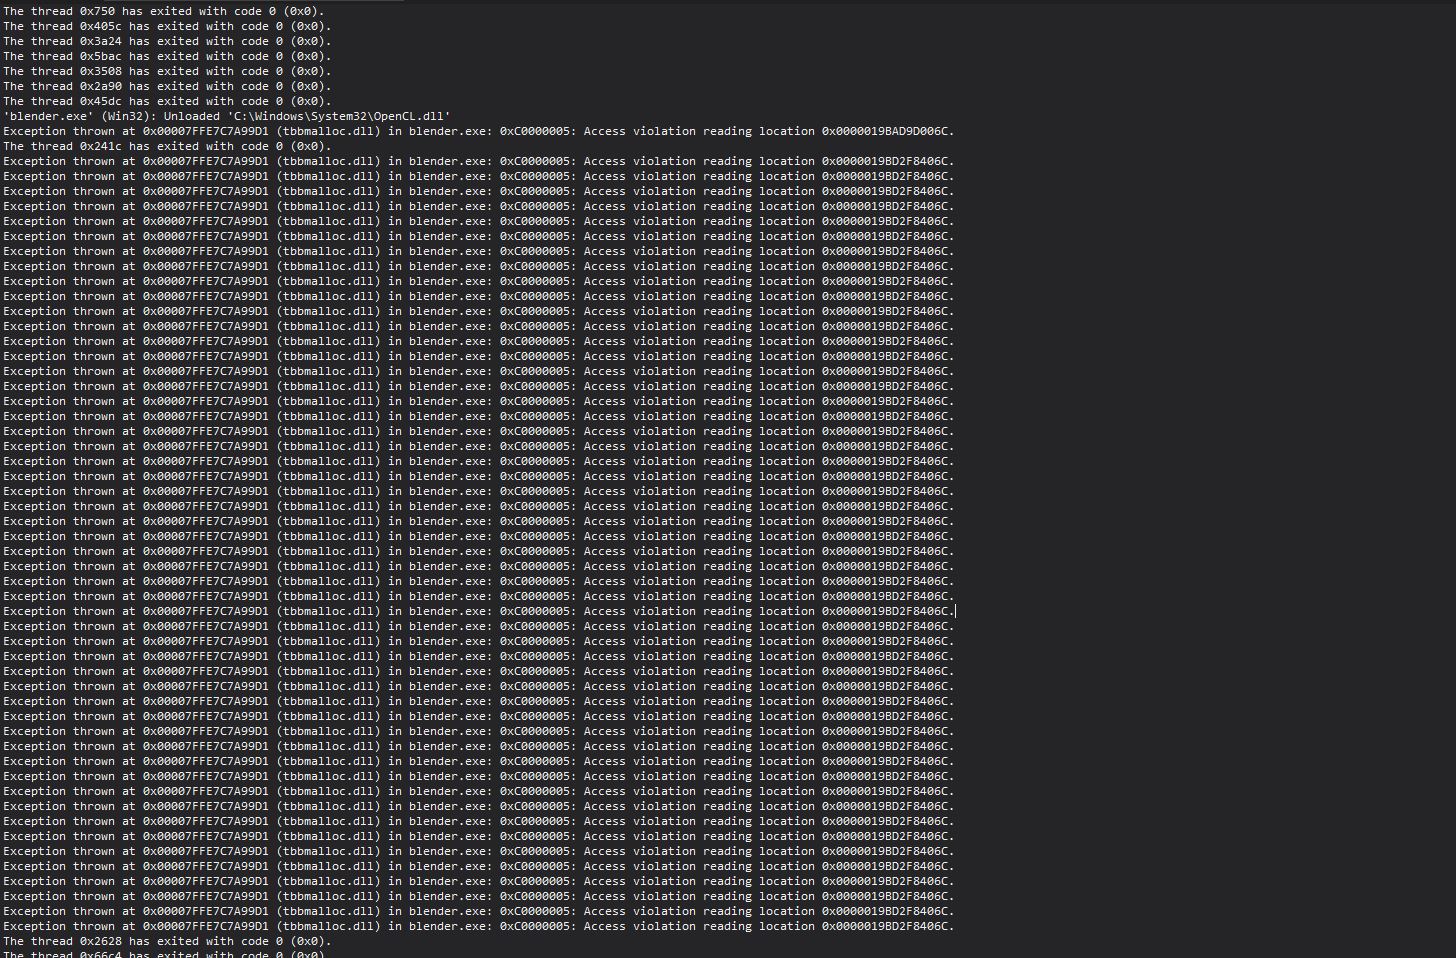
VS when the viewport is moving and RPR is rendering catching up.
Things going sideways in three parts.

Here’s output from the VS cmd window.
Oh no.
2022-11-28 21:43:29,625 INFO rpr.utils.user_settings [15096]:  Automatic save user preferences...
Writing userprefs: '[REDACTED]userpref.blend' ok
Info: Preferences saved
2022-11-28 21:43:29,629 INFO rpr.utils.user_settings [15096]:  Automatic save user preferences...
Writing userprefs: '[REDACTED]userpref.blend' ok
Info: Preferences saved
2022-11-28 21:43:29,629 INFO rpr.utils.user_settings [15096]:  Automatic save user preferences...
Writing userprefs: '[REDACTED]' ok
Info: Preferences saved
[MSG  @RIF]: Loaded RIF API version: 1.7.1.0xfdc139ba
INFO: Loading plugin: [REDACTED]addons\rprblender\amd_taau_ops.rml_plugin.dll
[MSG  @RIF]: Loaded RIF API version: 1.7.1.0xfdc139ba
[MSG  @RIF]: Loaded RIF API version: 1.7.1.0xfdc139ba
[MSG  @RIF]: Loaded RIF API version: 1.7.1.0xfdc139ba
2022-11-28 23:06:58,238 WARNING rpr.export.node [19188]:  Ignoring unsupported node <bpy_struct, ShaderNodeLightPath("Light Path") at 0x000002457532BAC8, evaluated> <bpy_struct, Material("FloorHidden") at 0x000002457534FE88, evaluated>
Error: Array length mismatch (got 4096, expected more)
2022-11-28 23:07:09,442 ERROR rpr.init [19188]:  internal error setting the array EXCEPTION: Traceback (most recent call last):
File "[REDACTED]addons\rprblender\__init__.py", line 141, in render
  self.engine.render()
File "[REDACTED]addons\rprblender\engine\preview_engine.py", line 83, in render
  result.layers[0].passes.foreach_set('rect', image.flatten())
RuntimeError: internal error setting the array

[MSG  @RIF]: Loaded RIF API version: 1.7.1.0xfdc139ba
[MSG  @RIF]: Loaded RIF API version: 1.7.1.0xfdc139ba
[MSG  @RIF]: Loading model: [REDACTED]addons\rprblender\data\models/denoise_c9_ldr.pb
INFO: Memory: required: 13172736, single node max: 11010048, requested sum: 35258368
[MSG  @RIF]: Loading model: [REDACTED]addons\rprblender\data\models/upscale2x_fast.pb
INFO: Memory: required: 25034752, single node max: 22020096, requested sum: 38141952
2022-11-28 23:07:18,812 INFO rpr.utils.user_settings [15096]:  Automatic save user preferences...
Writing userprefs: '[REDACTED]userpref.blend' ok
Info: Preferences saved
[MSG  @RIF]: Loaded RIF API version: 1.7.1.0xfdc139ba
[MSG  @RIF]: Loaded RIF API version: 1.7.1.0xfdc139ba
[MSG  @RIF]: Loaded RIF API version: 1.7.1.0xfdc139ba
[MSG  @RIF]: Loaded RIF API version: 1.7.1.0xfdc139ba
[MSG  @RIF]: Loading model: [REDACTED]addons\rprblender\data\models/denoise_c9_ldr.pb
INFO: Memory: required: 180158464, single node max: 150667264, requested sum: 476512256
[MSG  @RIF]: Loading model: [REDACTED]scripts\addons\rprblender\data\models/upscale2x_fast.pb
INFO: Memory: required: 342491136, single node max: 301268992, requested sum: 521535488
Thank you and if it makes anybody feel better this still renders like a hot damn compared to before. Did it use ML before? I don’t remember ML upscaling being present.
Issue Analytics
- State:

- Created 10 months ago
- Comments:6
 Top Related StackOverflow Question
 Troubleshoot Live Code
 Top Related Reddit Thread
 Top Related Hackernoon Post
 Top Related Tweet
 Top Related Dev.to Post
 Top Related Hashnode Post
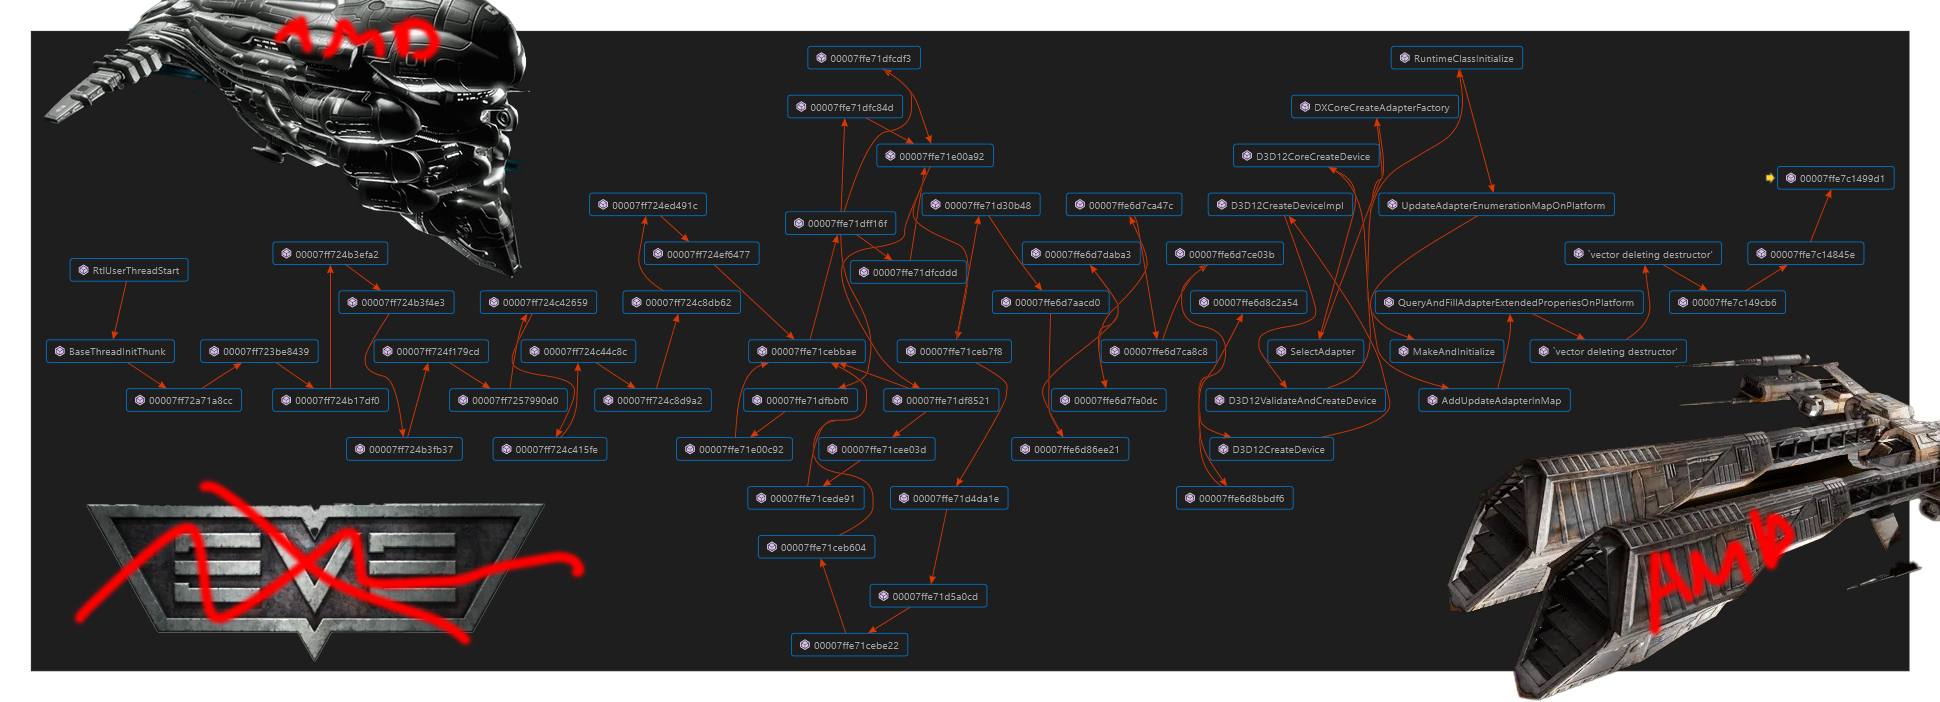
@bsavery just an update this isn’t an RPR issue AFAIK, this has got to be Blender side as it just crept up at the same time as many others are having strange somewhat similar problems. Things like bump nodes and such. W/E RPR triggers probably isn’t RPRs fault. There’s about 500 counts of GL_ARB_conservative_depth in a short blender debug file when anything with a shader gets touched.
I wanted to check my OpenCL because of the confusion earlier so I put Luxcore into play with their standalone benchmark and the development release of the blendluxcore plugin. No issues. Switched to RPR in viewport, kicked access violation and 6gb of VRAM to render a cube. Switched back to Luxcore, access violation. Change the view port from material preview to shaded, access violation.
Same thing as was going on with EEVEE and Cycles, everything is solid until RPR gets used and that makes no sense. Also, Blender died while rendering using RPR, GPU VRAM was at 6.5gb or so, nothing running anymore, Blender was gone, the GPU VRAM was still in use. It just stayed there doing nothing. I went grocery shopping and got back an hour or so later, still in use and couldn’t find anything with process explorer.
Opened Blender, access violation.
I’m closing this because there’s too much dev movement with Blender and AMD right now both are having issues that intertwine with all this nonsense, Eevees upgrades, AMD’s drivers and such.