
Stuck on an issue?
Lightrun Answers was designed to reduce the constant googling that comes with debugging 3rd party libraries. It collects links to all the places you might be looking at while hunting down a tough bug.
And, if you’re still stuck at the end, we’re happy to hop on a call to see how we can help out.
[BUG] "overlay-correlate" example not working
See original GitHub issue- I realize finplot is not a web lib. (Hint: it’s native!)
- I’ve read the snippets and not found what I’m looking for.
- I’ve searched for any related issues and avoided creating a duplicate issue.
- I’ve updated finplot (
pip install -U finplot). - I’ve supplied the required data to run my code below.
Code to reproduce
#!/usr/bin/env python3
from datetime import date, timedelta
import finplot as fplt
import pandas as pd
import scipy.optimize
import yfinance as yf
now = date.today()
start_day = now - timedelta(days=55)
df = yf.download('GOOG', start_day.isoformat(), now.isoformat(), interval='90m')
dfms = yf.download('MSFT', start_day.isoformat(), now.isoformat(), interval='90m')
# resample to daily candles, i.e. five 90-minute candles per business day
dfd = df.Open.resample('D').first().to_frame()
dfd['Close'] = df.Close.resample('D').last()
dfd['High'] = df.High.resample('D').max()
dfd['Low'] = df.Low.resample('D').min()
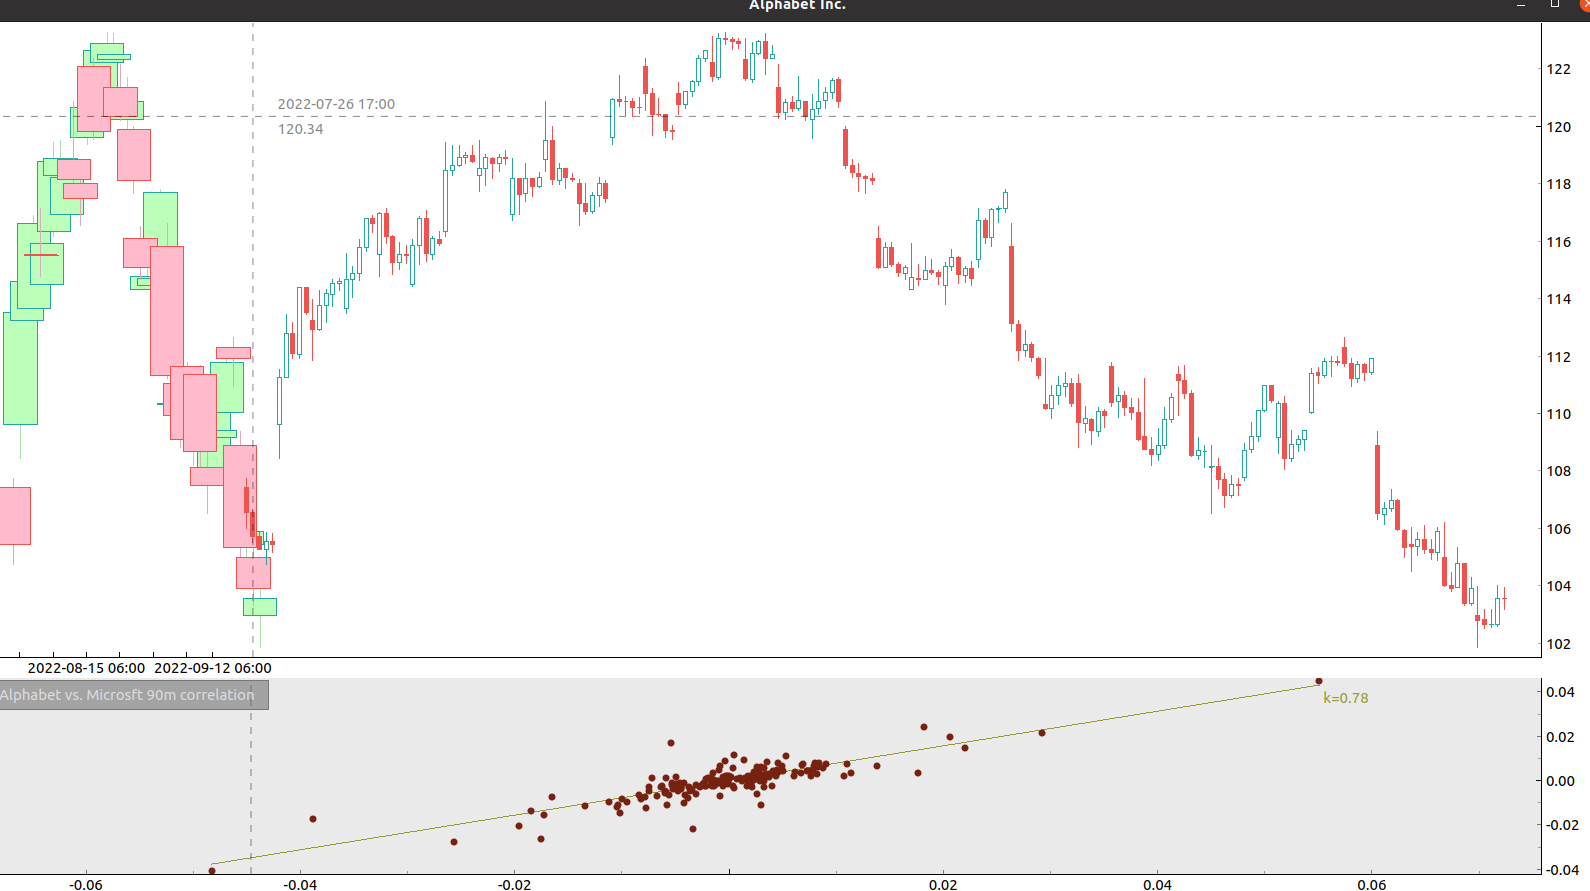
ax,ax2 = fplt.create_plot('Alphabet Inc.', rows=2, maximize=False)
ax2.disable_x_index() # second plot is not timebased
# plot down-sampled daily candles first
daily_plot = fplt.candlestick_ochl(dfd.dropna(), candle_width=5)
daily_plot.colors.update(dict(bull_body='#bfb', bull_shadow='#ada', bear_body='#fbc', bear_shadow='#dab'))
daily_plot.x_offset = 3.1 # resample() gets us start of day, offset +1.1 (gap+off center wick)
# plot high resolution on top
fplt.candlestick_ochl(df[['Open','Close','High','Low']])
# scatter plot correlation between Google and Microsoft stock
df['ret_alphabet'] = df.Close.pct_change()
df['ret_microsoft'] = dfms.Close.pct_change()
dfc = df.dropna().reset_index(drop=True)[['ret_alphabet', 'ret_microsoft']]
fplt.plot(dfc, style='o', color=1, ax=ax2)
# draw least-square line
errfun = lambda arr: [y-arr[0]*x+arr[1] for x,y in zip(dfc.ret_alphabet, dfc.ret_microsoft)]
line = scipy.optimize.least_squares(errfun, [0.01, 0.01]).x
linex = [dfc.ret_alphabet.min(), dfc.ret_alphabet.max()]
liney = [linex[0]*line[0]+line[1], linex[1]*line[0]+line[1]]
fplt.add_line((linex[0],liney[0]), (linex[1],liney[1]), color='#993', ax=ax2)
fplt.add_text((linex[1],liney[1]), 'k=%.2f'%line[0], color='#993', ax=ax2)
fplt.add_legend('Alphabet vs. Microsft 90m correlation', ax=ax2)
fplt.show()
Describe the bug
In my best of opinion, instead of overlay candelles the example code just append the two database.
Expected behavior
I tried something like that but it didn’t work well:
daily_plot = fplt.candlestick_ochl(dfd.dropna(), candle_width=5, ax=ax)
fplt.candlestick_ochl(df[['Open','Close','High','Low']], ax=ax.overlay(scale=1.0, yaxis='linear'))
Screenshots
Reproducible in:
OS: windows 11 - ubuntu 20.04 finplot version: 1.8.2 pyqtgraph version: 0.12.4 pyqt version: PyQt5 python version: 3.8 - 3.10
Issue Analytics
- State:

- Created a year ago
- Comments:7 (4 by maintainers)
 Top Results From Across the Web
Intermittent errors plotting 2 series on 1 chart as highlighting #95
I am having a problem with the plotting of two series. ... namely the overlay in "example-overlay-correlate.py" and the updating in ...
Read more >How do you fix a bug you can't replicate? - Stack Overflow
Pointer issues are arduous to track and replicate, but debuggers can help (such as GDB and DDD). Java. An application that has multiple...
Read more >Overlay, Correlate & Tile Graphs - LoadRunner Analysis
Analysing the graphs in a single and separate windows makes analysis work hectic and time-consuming. To overcome this problem the LoadRunner ...
Read more >Finance Plot - finplot · PyPI
Comes with a dozen great examples. feature1 ... It does not work with Jupyter Labs. ... See second axis of example-overlay-correlate.py.
Read more >Key AWS ELB Monitoring Metrics - Datadog
As usual not all metrics are useful in all situations. This is a cheat sheet for sane AWS ELB monitoring: HealthyHostCount and Latency...
Read more > Top Related Medium Post
No results found
 Top Related StackOverflow Question
No results found
 Troubleshoot Live Code
Lightrun enables developers to add logs, metrics and snapshots to live code - no restarts or redeploys required.
Start Free Top Related Reddit Thread
No results found
 Top Related Hackernoon Post
No results found
 Top Related Tweet
No results found
 Top Related Dev.to Post
No results found
 Top Related Hashnode Post
No results found
Release 1.8.3 out now! 😃
What pandas version are you using? I’m using 1.4.2, and that seems to work fine.