
Stuck on an issue?
Lightrun Answers was designed to reduce the constant googling that comes with debugging 3rd party libraries. It collects links to all the places you might be looking at while hunting down a tough bug.
And, if you’re still stuck at the end, we’re happy to hop on a call to see how we can help out.
onPress event on Pie Chart
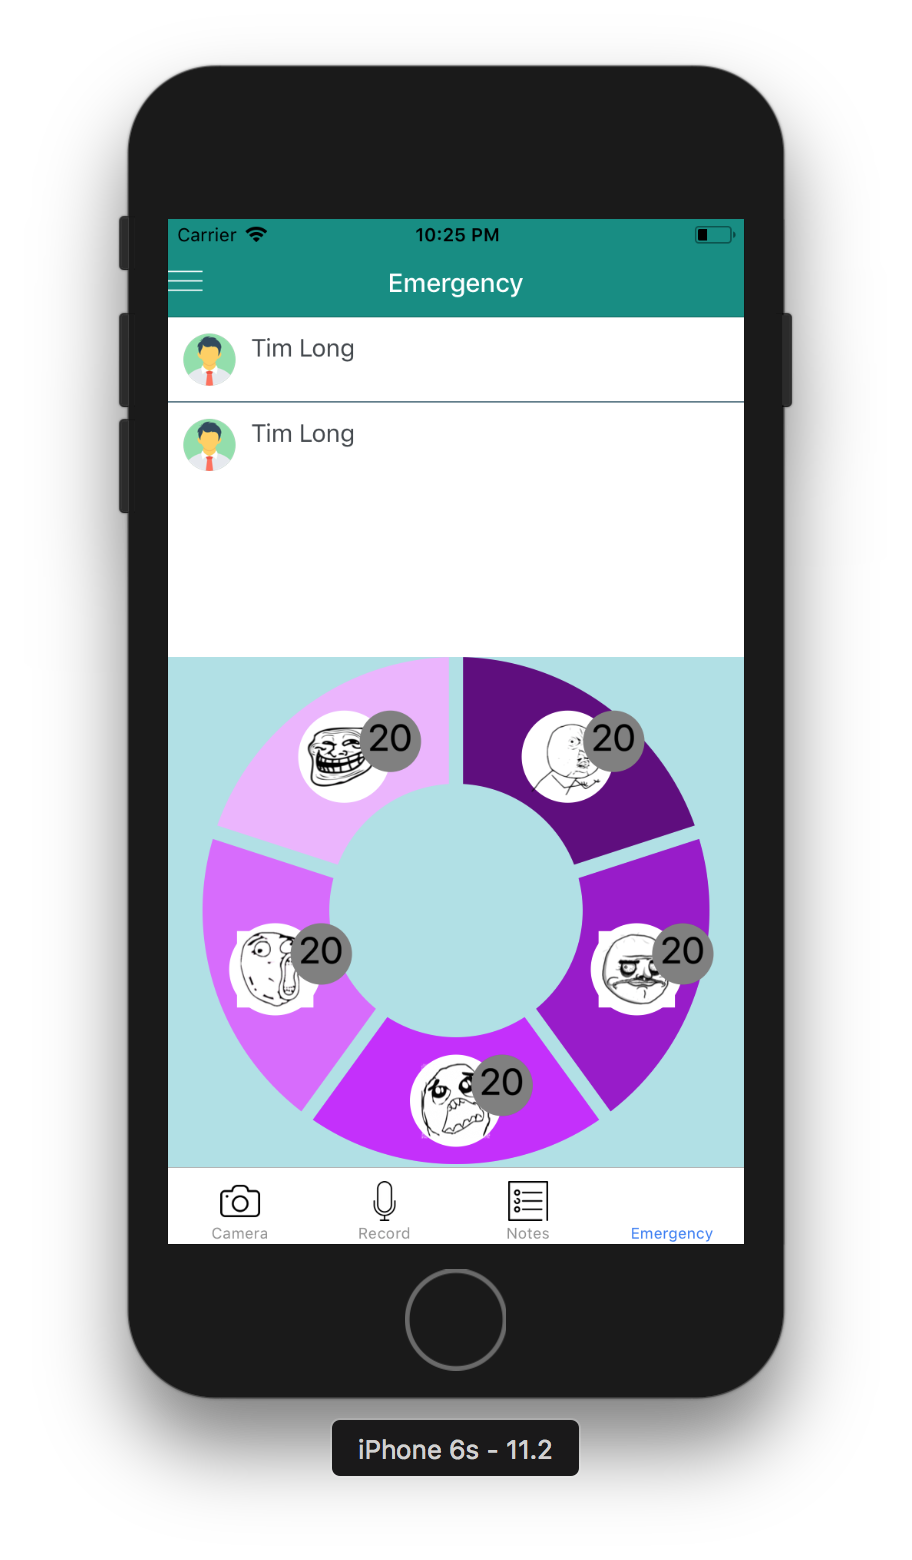
See original GitHub issueI referred to the examples repo and was able to build something like the attached. Reference issue #131
Now, I am stuck with touch event, as I am not able to get onpress() event callback
 render() {
    const data = [
      {
        key: 1,
        amount: 20,
        amount1: 30,
        svg: { fill: '#600080' },
      },
      {
        key: 2,
        amount: 20,
        amount1: 40,
        svg: { fill: '#9900cc' }
      },
      {
        key: 3,
        amount: 20,
        amount1: 50,
        svg: { fill: '#c61aff' }
      },
      {
        key: 4,
        amount: 20,
        amount1: 60,
        svg: { fill: '#d966ff' }
      },
      {
        key: 5,
        amount: 20,
        amount1: 70,
        svg: { fill: '#ecb3ff' }
      }
    ]
    const Labels = ({ slices, height, width }) => {
      return slices.map((slice, index) => {
        const { labelCentroid, pieCentroid, data } = slice;
        return (
          <G
            key={index}
            x={labelCentroid[0]}
            y={labelCentroid[1]}
            onPress={ () => console.log('tooltip clicked') }
          >

            <Circle
               r={30}
               fill={'white'}
           />
           <Image
             x={-25}
             y={25}
               width={50}
               height={50}
               preserveAspectRatio="xMidYMid slice"
               opacity="1"
               href={Images.memes[ index + 1 ]}
           />
            <Circle
               r={20}
               x={30}
               y={-10}
               fill={'gray'}
           />
           <Text
              key={index}
              x={30}
              y={-10}
              // x={pieCentroid[0]}
              // y={pieCentroid[1]}
              fill={'black'}
              textAnchor={'middle'}
              alignmentBaseline={'middle'}
              fontSize={24}
              stroke={'black'}
              strokeWidth={0.2}
            >
              {data.amount}
            </Text>
          </G>


        )
      })
    }


    const resizeMode = 'center';
    return (

      <View style={styles.MainContainer}>
          <PieChart
            style={{ height: 330 }}
            valueAccessor={({ item }) => item.amount}
            data={data}
            spacing={20}
            outerRadius={'100%'}
          >

            <Labels />

          </PieChart>

        </View>

    );
  }
const styles = StyleSheet.create({
  MainContainer: {
    // Setting up View inside content in Vertically center.
    flex: 1,
    flexDirection: 'column',
    backgroundColor: 'white'

  }
});
Any inputs will be helpful
Issue Analytics
- State:

- Created 5 years ago
- Comments:5 (3 by maintainers)
 Top Results From Across the Web
Click events on Pie Charts in Chart.js - Stack Overflow
Calling getElementsAtEvent(event) on your Chart instance passing an argument of an event, or jQuery event, ... ChartJS : pie Chart - Add options...
Read more >How to Use Onclick Event to Expand Pie Slices in Chart js
How to Use Onclick Event to Expand Pie Slices in Chart jsIn this video we will cover how to use onclick event to...
Read more >Pie Chart Advanced Topics Event Handlers - ZoomCharts
Pie Chart provides a set of events for your application to use. onClick(event) - function to be called on click. onRightClick(event) - function...
Read more >MDB Pie chart Onclick event - Material Design for Bootstrap
How to create custom onclick function?? i am using MDB Pie chart in my web application. I have 5 labels for my pie...
Read more >Click events on Pie Charts in Chart.js - Javascript - Java2s.com
getContext("2d"); var myNewChart = new Chart(ctx, { type: 'pie', data: data }); canvas.onclick = function(evt) { var activePoints = myNewChart.
Read more > Top Related Medium Post
No results found
 Top Related StackOverflow Question
No results found
 Troubleshoot Live Code
Lightrun enables developers to add logs, metrics and snapshots to live code - no restarts or redeploys required.
Start Free Top Related Reddit Thread
No results found
 Top Related Hackernoon Post
No results found
 Top Related Tweet
No results found
 Top Related Dev.to Post
No results found
 Top Related Hashnode Post
No results found
Why is it close? I am facing this issue is IOS where onPress is not being called. But it works fine in Android. I tried onPressIn and onPressOut but it didnt work
@JesperLekland Thanks for the input. I was able to find a way out based on your suggestions
Reference for the methods
export interface TouchableProps { disabled?: boolean, onPress?: (event: any) => any, onPressIn?: (event: any) => any, onPressOut?: (event: any) => any, onLongPress?: (event: any) => any, delayPressIn?: number, delayPressOut?: number, delayLongPress?: number }
Below is the working code.
Please let me know if I am going wrong with this approach