
Stuck on an issue?
Lightrun Answers was designed to reduce the constant googling that comes with debugging 3rd party libraries. It collects links to all the places you might be looking at while hunting down a tough bug.
And, if you’re still stuck at the end, we’re happy to hop on a call to see how we can help out.
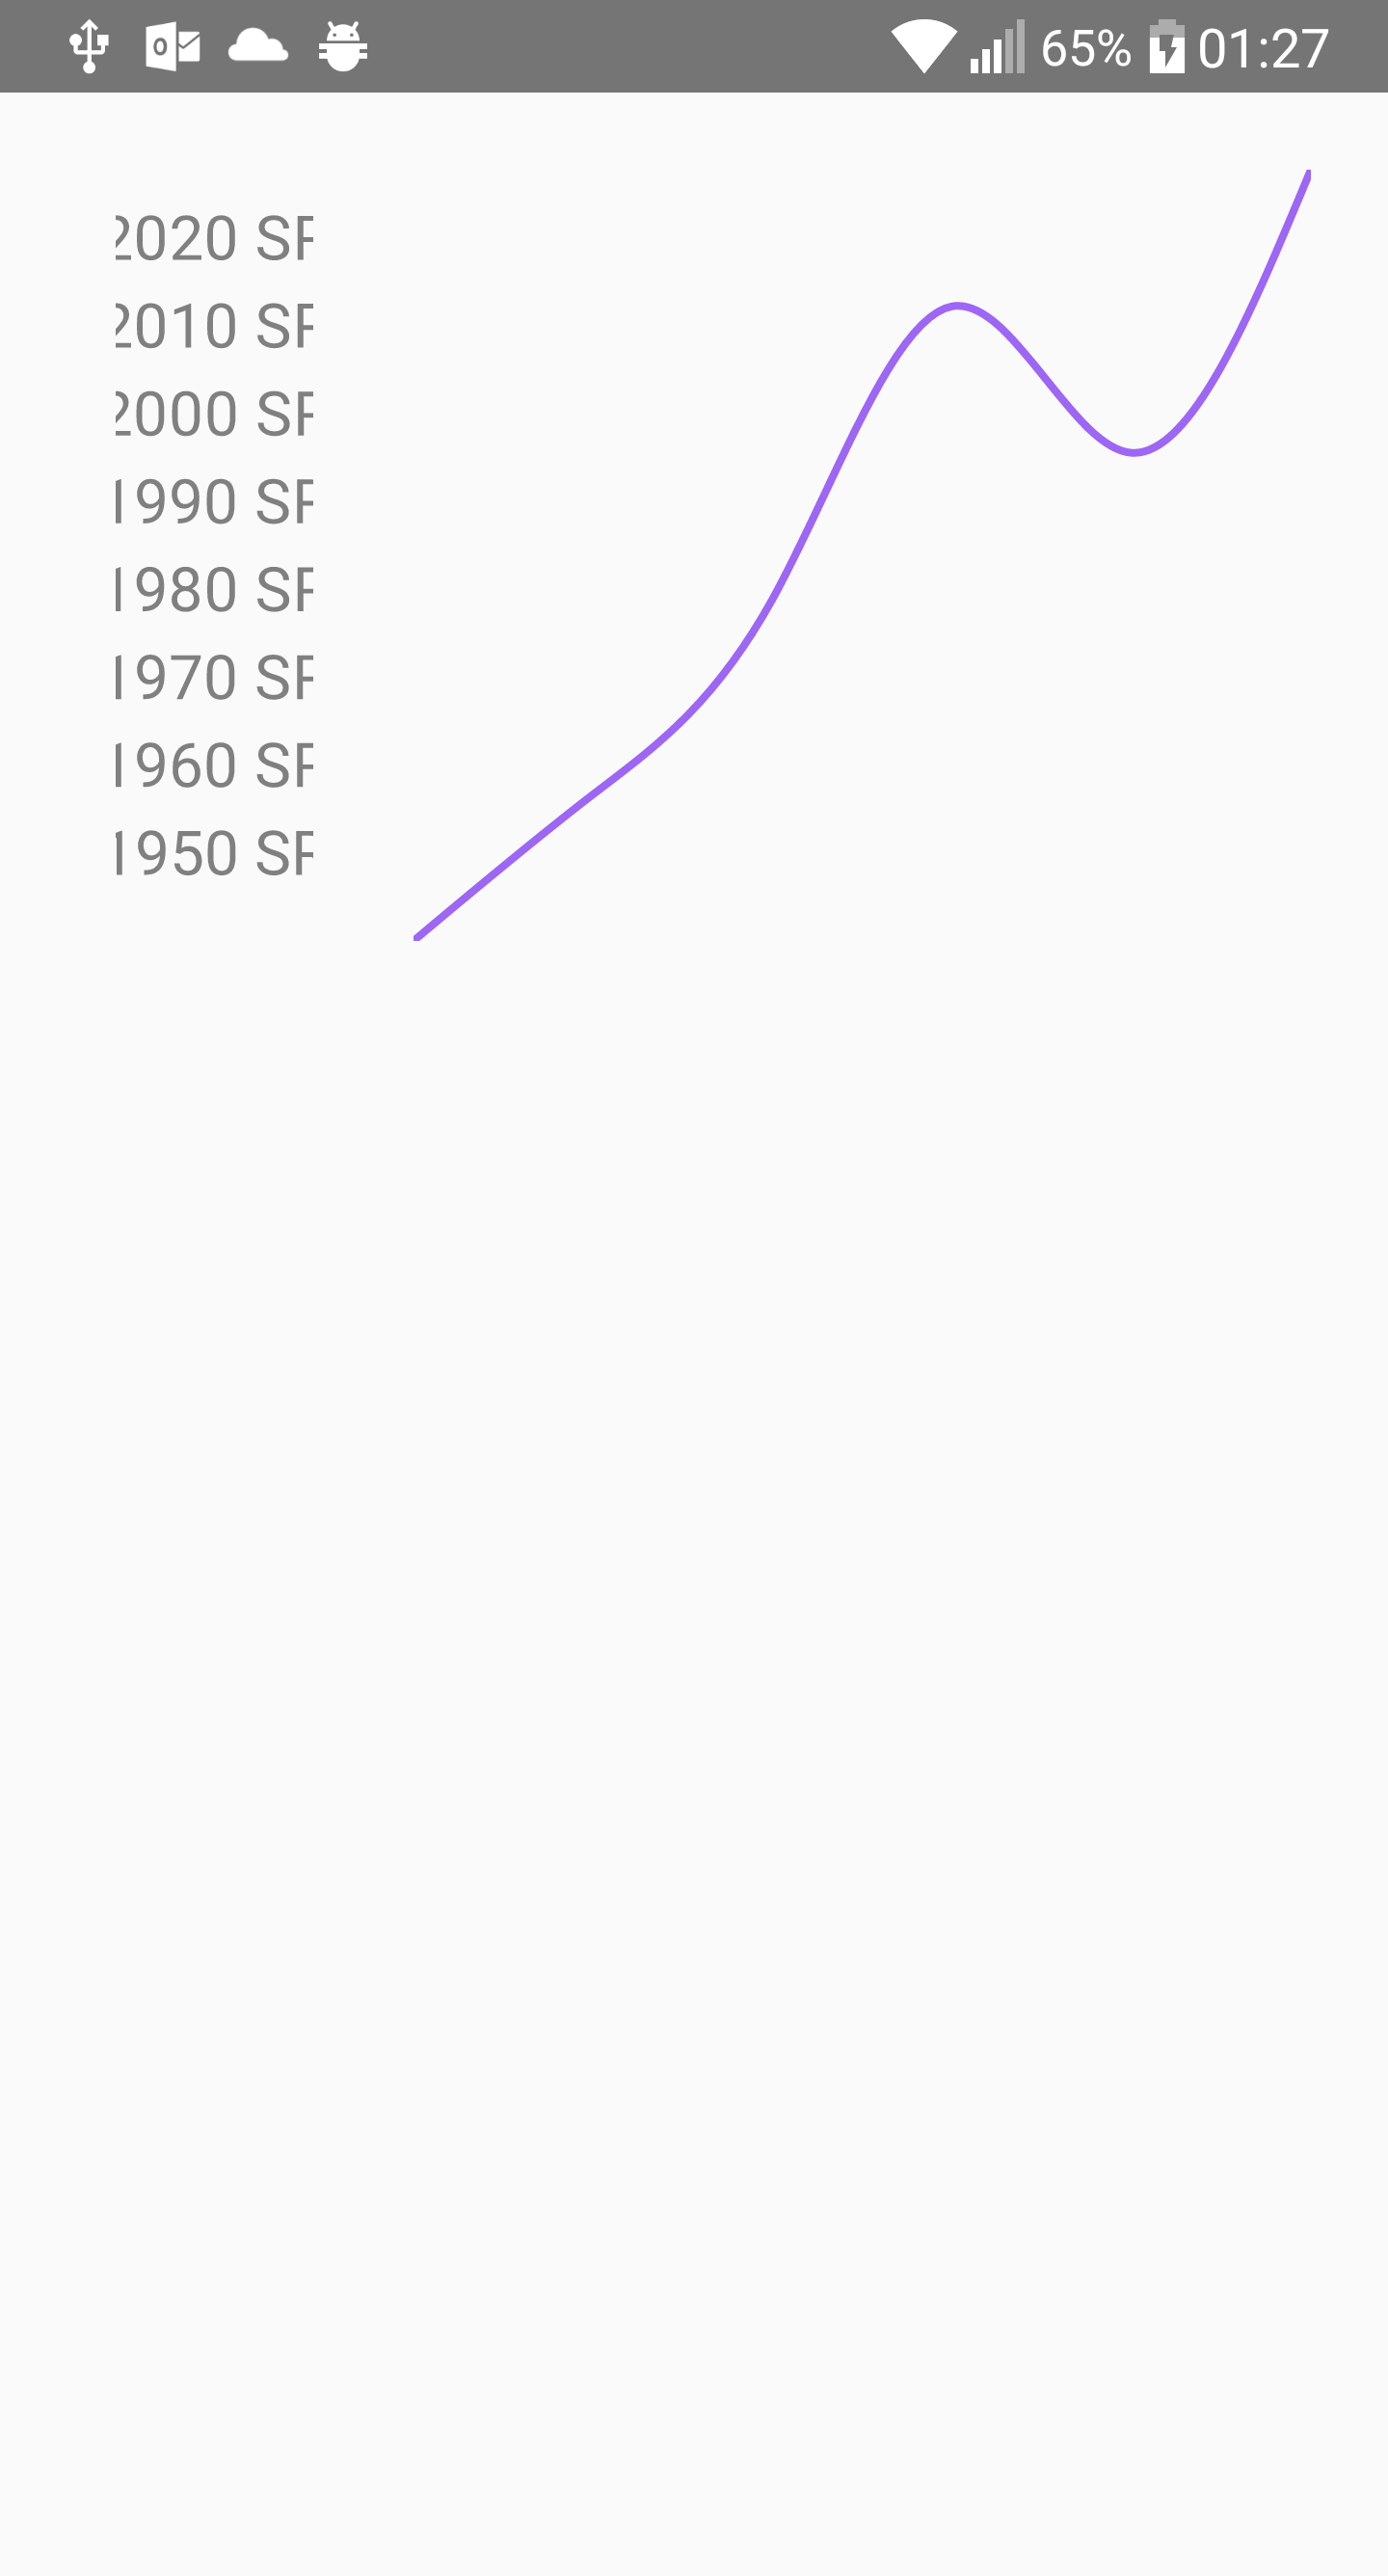
YAxis labels are cut off
See original GitHub issueWhat is the problem?
The YAxis labels are not fully displayed, they are cut off both at the left and right side.
When does it happen?
When attempting to make a simple Line Chart with a YAxis.
What platform?
- iOS
- Android 7
React Native version: 0.55.4
Code to reproduce
import React, { Component } from 'react';
import {
    Platform,
    StyleSheet,
    Text,
    View
} from 'react-native';

import { AreaChart, LineChart, Grid, YAxis } from "react-native-svg-charts";
import * as shape from 'd3-shape';

export default class App extends Component {
    render() {

        const data = [ 1945, 1960, 1980, 2010, 1995, 2024]

        const contentInset = { top: 20, bottom: 20 }

        return (
            <View style={{ height: 200, flexDirection: 'row', margin: 20}}>
                <YAxis
                    style={{padding: 10}}
                    data={ data }
                    svg={{
                        fill: 'grey',
                        fontSize: 16,
                        padding: 20
                    }}
                    numberOfTicks={ 10 }
                    formatLabel={ value => `${value} SR` }
                />
                <LineChart
                    style={{ flex: 1, marginLeft: 16 }}
                    data={ data }
                    curve={ shape.curveNatural }
                    svg={{ stroke: 'rgba(134, 65, 244, 0.8)', strokeWidth: 2}}
                >
                </LineChart>
            </View>
        )
    }
}
Issue Analytics
- State:

- Created 5 years ago
- Comments:10 (3 by maintainers)
 Top Results From Across the Web
Second y-axis label getting cut off - Stack Overflow
I'm trying to plot two sets of data in a bar graph with matplotlib, so I'm using two axes with the twinx() method....
Read more >Y axis label get cut off if the value is long - Highcharts
Hi, I am facing one issue related to Y axis label where if the label size is long then it will get cut...
Read more >y axis label cut off in log scale · Issue #464 · matplotlib/ipympl
As the title says. In Jupyter Lab the y label is cutoff if using log scale and the numbers on the scale get...
Read more >Y-Axis Labels Cut Off - Looker Studio Community
Y-Axis Labels Cut Off. On the right Y-axis, the labels are cut off. The top label should say 100% but it cuts it...
Read more >Y axis labels cut off in barchart - Microsoft Power BI Community
Solved: Of course I have limited space on my dashboard but I'd like to see the axis of my barchart. Can I adjust...
Read more > Top Related Medium Post
No results found
 Top Related StackOverflow Question
No results found
 Troubleshoot Live Code
Lightrun enables developers to add logs, metrics and snapshots to live code - no restarts or redeploys required.
Start Free Top Related Reddit Thread
No results found
 Top Related Hackernoon Post
No results found
 Top Related Tweet
No results found
 Top Related Dev.to Post
No results found
 Top Related Hashnode Post
No results found
Here’s how I’ve solved it:
formatLabel={ value => ' ' +${value} Items+ ' ' }where previously I would seeitemwith half the of the M cut off, adding in these extra spaces made it render correctly.Have the same issue, but with XAxis. I cpuldn’t figure out how to add height to svg container