Questions on PlotAggregate
See original GitHub issueHello, msbentsen, I have some questions when using TOBIAS for my ATAC-seq data analysis, I read the docs on TOBIAS Github, but still confused. My atac-seq analysis propose is finding different TFBS motifs of A549 cell line between conditionA and conditionB; And my analysis route like:
- after alignment, i use macs2 for peak calling and got
conditionA.narrowpeakandconditionB.narrowpeak(they are whole open site of each conditon); - then performed diff-peak analysis, then got peaks of unique open region of each condition,
uniq_open_in_A.bedanduniq_open_in_B.bed(they are sub-set of conditionA.narrowpeak and conditionB.narrowpeak); - then use homer for motif enrichment on those unique open regions, and got interested motifs of each condition; till here, i got diff chromatin open regions uniq_open_in_A.bed and uniq_open_in_B.bed and motif on those region;
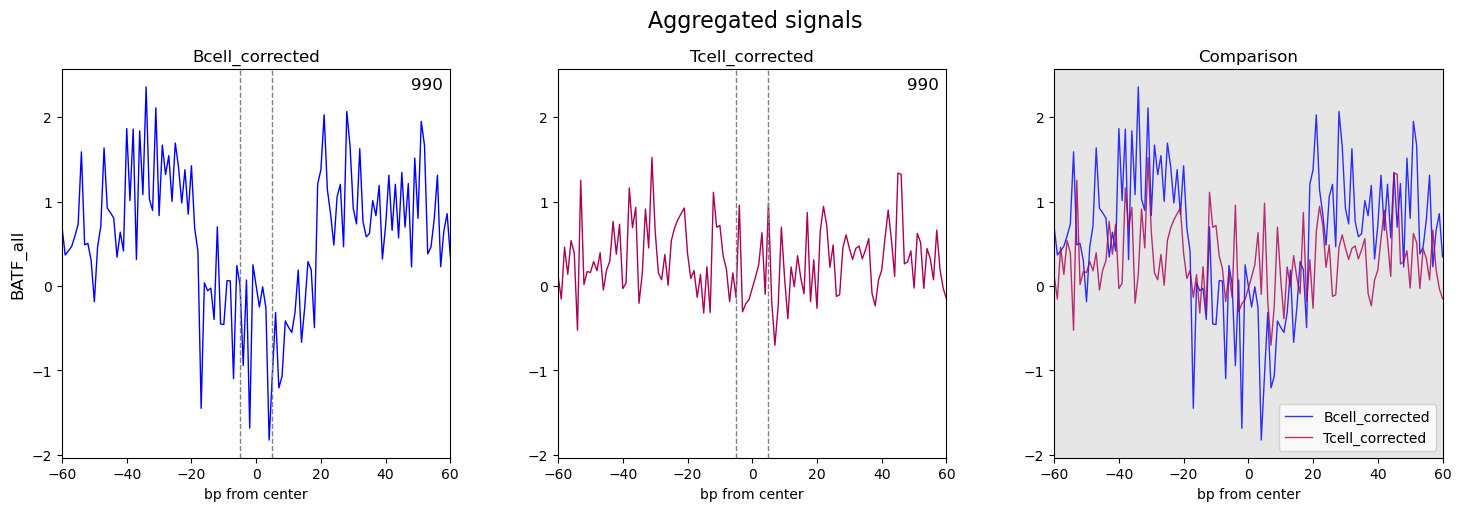
Next, I use TOBIAS for TF footprint analysis; after ATACorrect --> ScoreBigwig --> BINDetect --> PlotAggregate, I got my results, seems not the expected one(no obviously footprint on the aggregate plot on most enriched motif). Here are my aggregate plots:
 compare to your example pic, it’s quite a different:

Also, I made an aggregate plot between uncorrected and corrected, still not expected(the curve shape of uncorrected and corrected are very same, just one position higher than another on the Y-axis). Here’s the pic:

I tried for couple of days, still cannot get a good plot on each condition.
So I will ask some question based on the information above:
- The result of scorebigwig(footprint.bw) and bindetect(TFBS.bed files) fit my expected result. But why aggregate-plot won’t show a ‘good-shaped’ footprint plot? If aggregate-plot is not good, can I still rely on footprint.bw and TFBS.bed files?
- I have conditionA and B .narrowpaek for the whole peak of two conditions, also uniq_open_A and B .bed for unique open regions(a subset of the whole peak), which kind of peak should I use in:
- ATACorrect --peaks
- ScoreBigwig --regions
- BINDetect --peaks I tried both(whole peak and unique open peak), but cannot get a ‘good’ aggregate plot
- In aggregate plot: the plot curve between corrected.bw and uncorrected.bw, why their shape is so same, and just different position on Y-axis(not like figures in TOBIAS paper and GitHub), does this mean my correction won’t work? Please see pics above; My ATACorrect code is
TOBIAS ATACorrect \
    --bam conditionA.bam \
    --genome $hg38_path \
    --peaks uniq_open_A.bed \
    --blacklist $blacklist_path \
    --outdir ATACorrect_out \
    --cores 20
-
When plotting aggregate footprint, I try to use --smooth 3 or 5, with this param, I can get a ‘better’ footprint plot, does this try make sense? Here is the smoothed pic:

-
in
PlotAggregatemethod, What is the difference between these two arguments:--regionsand--whitelist
Hope you can give me some advice, thanks.
Issue Analytics
- State:
- Created 2 years ago
- Comments:10 (5 by maintainers)

 Top Related StackOverflow Question
Great, I’m glad we got it solved in the end! I’m closing this issue but feel free to open another in case of other questions.
Hi msbentsen:
I think you are right, it’s my hg38 issue. I changed hg38.fa and performed ATACorrect again, got the clearly Tn5 motif.
Thank you so much for the patience help, and may the force be with you!
Best Chu