
Lightrun Answers was designed to reduce the constant googling that comes with debugging 3rd party libraries. It collects links to all the places you might be looking at while hunting down a tough bug.
And, if you’re still stuck at the end, we’re happy to hop on a call to see how we can help out.
lmplot fails with lowess=True
See original GitHub issueDear Seaborn developpers,
I’m trying a simple lmplot that fails as follows:
In [22]: sns.lmplot(data=go, x="states", y="rate", lowess=True)
/home/franck/.local/lib/python3.5/site-packages/numpy/lib/function_base.py:4016: RuntimeWarning: Invalid value encountered in median
  r = func(a, **kwargs)
/home/franck/.local/lib/python3.5/site-packages/statsmodels/nonparametric/smoothers_lowess.py:165: RuntimeWarning: invalid value encountered in greater_equal
  res = _lowess(y, x, frac=frac, it=it, delta=delta)
Out[22]: <seaborn.axisgrid.FacetGrid at 0x7ff15d5b97f0>
The data is not something complicated or strange, here is the CSV:
go.csv.gz
As a result, I got the scatter plot but not the smoothed curve:
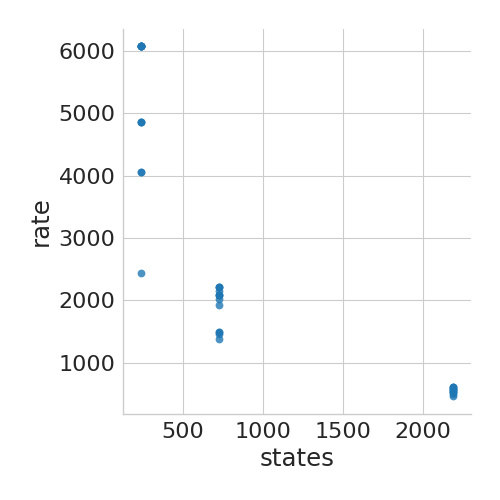
I have many other similar data sets that cause no problem, I’ve just isolated this particular one that fails. I’m working with Python 3.5.2, Seaborn 0.8.1, Numpy 1.13.3, and Statsmodel 0.8.0.
Any help will be very wellcome, thanks in advance! Franck
Issue Analytics
- State:

- Created 6 years ago
- Comments:5 (3 by maintainers)
 Top Related StackOverflow Question
 Troubleshoot Live Code
 Top Related Reddit Thread
 Top Related Hackernoon Post
 Top Related Tweet
 Top Related Dev.to Post
 Top Related Hashnode Post
Yep, I think issue is what’s happening here. I can’t explain exactly what statsmodels is doing, but it makes sense. “lowess” stands for “locally weighted smoothing”. There is at least one segment in your dataset where for a reasonable definition of “local”, there is nothing to smooth.
I don’t think seaborn should do anything here. Raising would be annoying if you’re trying to draw a big facet grid where one or two subsets has a failing lowess. A warning would be good, but statsmodels is in the better position to give an informative warning about exactly what’s happening. All seaborn can do really is say that “something” has gone wrong, but that’s already obvious from the lack of a line on the plot.
But I don’t know how you call it… 😃 I’ve patched around the call
res = _lowess(y, x, frac=frac, it=it, delta=delta)to observe parameters and return value. It yields:Can you confirm this is a bug in statsmodels?