
Lightrun Answers was designed to reduce the constant googling that comes with debugging 3rd party libraries. It collects links to all the places you might be looking at while hunting down a tough bug.
And, if you’re still stuck at the end, we’re happy to hop on a call to see how we can help out.
Feature Request: Join WeekEnd Time Gaps in Candlestick Plot and Custom Data Columns
See original GitHub issueHi!
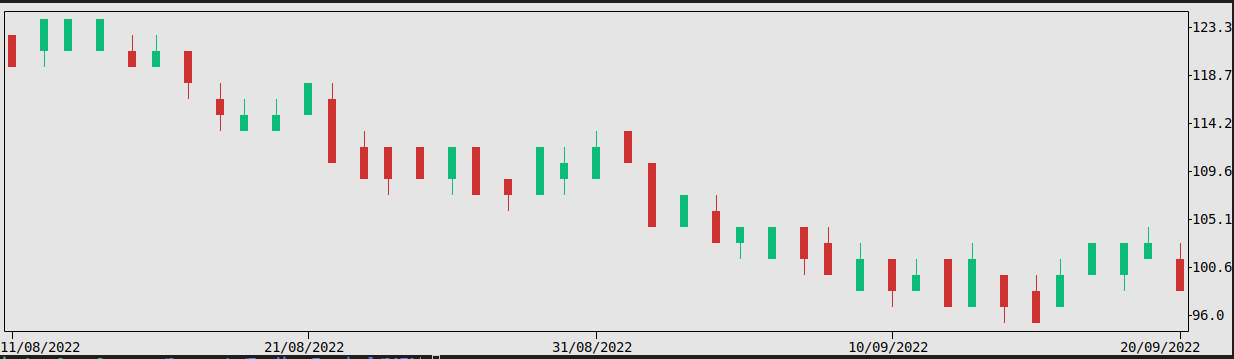
I found the easiest solution to have a plot without holes For that I have to add a new column with merged dates, this solution is fine if you do not need the right dates.
1.I think easiest way to add this feature to PloText is to add second index which will be just counter Counter will be used for plotting without holes and Date column will be used for Displaying dates on plot
2.Additional will be awesome to add custom naming for columns, ‘Date’,‘Open’,‘High’,‘Low’,‘Close’ not the only one, lot of data feeds name columns as ‘t’,‘o’,‘h’,‘l’,‘c’
P.S. I’m not a Pandas expert so there should be much better way to create a new index column.
import yfinance as yf
import plotext as plt

plt.date_form('d/m/Y')
start = plt.string_to_datetime('11/08/2022')
end = plt.string_to_datetime('10/10/2022')
data = yf.download('goog', start, end)


Merge=True
if Merge:
    l=[]
    import time
    import datetime
    d0=time.mktime(data.index[0].timetuple()) # Start Date
    for i,d in enumerate(data.index):
        l.append(datetime.datetime.fromtimestamp(d0+i*86400))
    data['index']=l # Add our merged dates to pandas dataframe
    data=data.reset_index(drop=False) # Reset index with saving index data
    data=data.set_index('index') # Set new dataframe index for timeline


dates = plt.datetimes_to_string(data.index)
plt.candlestick(dates, data,yside = 2)
plt.show()
Merge=False
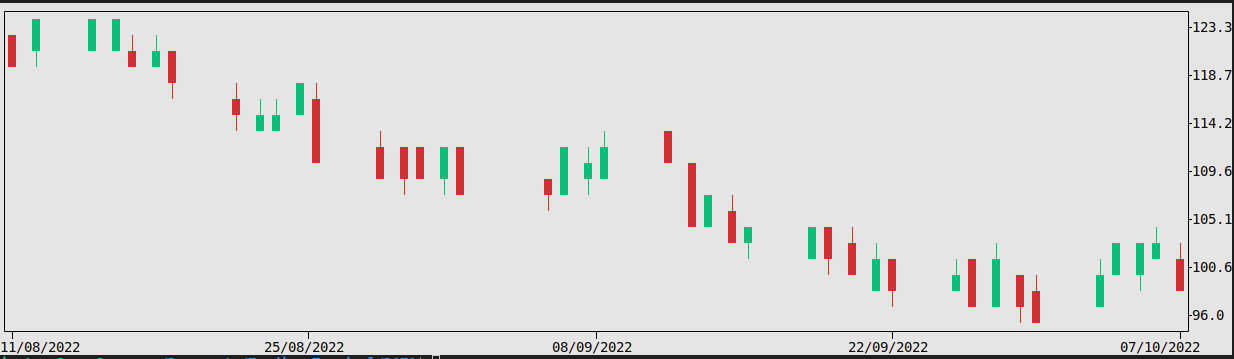
Merge=True
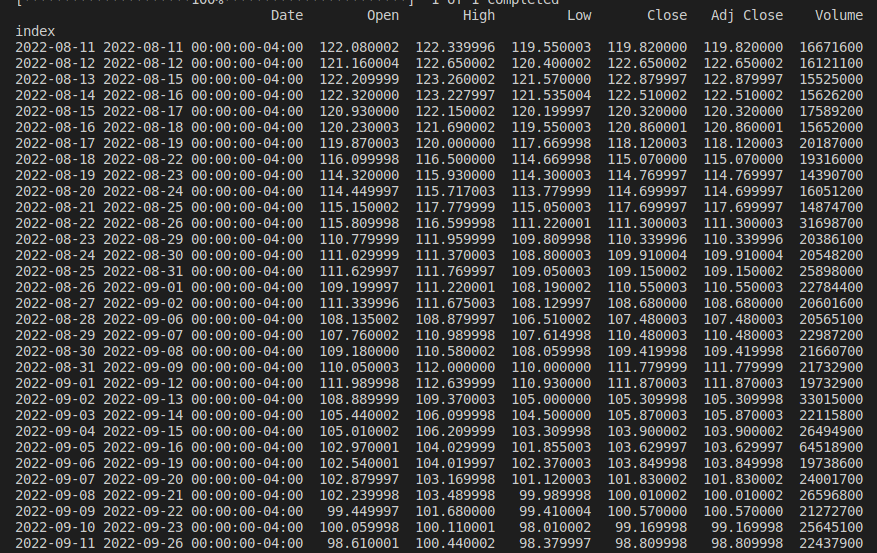
Pandas :
Issue Analytics
- State:

- Created a year ago
- Reactions:1
- Comments:5 (3 by maintainers)
 Top Related StackOverflow Question
 Troubleshoot Live Code
 Top Related Reddit Thread
 Top Related Hackernoon Post
 Top Related Tweet
 Top Related Dev.to Post
 Top Related Hashnode Post
Hi @ineteye, I will come back to this later on. Thanks for updating about it! All the best, Savino.
Checked mplfinance candlestick plots and they did not use column naming at all. Stock data always in format like that: ‘Date’,‘Open’,‘High’,‘Low’,‘Close’,‘Volume’ Column naming maybe different but order always like that, best options will be to use column order and not naming at all.