
Stuck on an issue?
Lightrun Answers was designed to reduce the constant googling that comes with debugging 3rd party libraries. It collects links to all the places you might be looking at while hunting down a tough bug.
And, if you’re still stuck at the end, we’re happy to hop on a call to see how we can help out.
Maximum Number of Subplots Reached
See original GitHub issueFor clarity, I transfer here this issue, initially posted in Issue 144, by @ineteye.
Hi!
I tried your code with bigger list but always getting error: ‘list index out of range’ on plt.show() Think its cause screen height
import plotext as plt
plt.clf()
plt.clc()
plt.subplots(1,2)

plt.subplot(1,1).plot([1,2])
plt.xfrequency(0)
plt.yfrequency(0)

plt.subplot(1,2).plot_size(10,None)

symbol = 'OMI'
symbols=['IONS','CDNA','*ARCT','*ARCT','*DVAX','ABBV','OSTK','PYPL','GMKN','AXSM','IRT','*ANF','CDNA','LCID','*VTNR','*RPD','NFLX','TOST','LOVE','CC','NVDA','PYPL','TWTR','*RCII','FRPT','BGS','VIRT','AMAT','RIFUSDT']

S = len(symbols)
plt.subplots(S, 1)
for s in range(S):
    bg = 'orange+' if symbols[s] == symbol else None
    plt.subplot(1,2).subplot(s + 1, 1).text(symbols[s], 0, 0, alignment="left", background = bg, color = 'white')
    plt.subplot(1,2).subplot(s + 1, 1).plotsize(None, 1) if s != S - 1 else None

plt.subplot(1,2)
plt.frame(0)
plt.xfrequency(0)
plt.yfrequency(0)
plt.xlim(0, 1)
plt.ylim(-1, 0)

plt.show()
_Originally posted by @ineteye in https://github.com/piccolomo/plotext/issues/144#issuecomment-1282871961_
Issue Analytics
- State:

- Created a year ago
- Comments:5 (3 by maintainers)
 Top Results From Across the Web
Large number of subplots with matplotlib - Stack Overflow
Try this: fig, ax = plt.subplots(10, 10). where ax will contain one hundred axis in a list (of lists). It is a really...
Read more >How to plot 17 subplots? - MATLAB Answers - MathWorks
I am trying to plot a large number of subplots, but want to make sure formartting is such that it takes the most...
Read more >Take Full Control Over the Subplots in Matplotlib - Regenerative
This article will focus on how to use subplots efficiently and take fine control over the grids. We will start with the basic...
Read more >The Deep Value of Subplots: With 10 Awesome Examples
The Value and Importance of Subplots: With 10 Amazing Examples. Subplots. Most movies and TV series have them, whether large or small.
Read more >Matplotlib Subplots - Plot Multiple Graphs Using ... - AskPython
The matplotlib subplots() method requires a number of rows and a number of columns as an input argument to it and it returns...
Read more > Top Related Medium Post
No results found
 Top Related StackOverflow Question
No results found
 Troubleshoot Live Code
Lightrun enables developers to add logs, metrics and snapshots to live code - no restarts or redeploys required.
Start Free Top Related Reddit Thread
No results found
 Top Related Hackernoon Post
No results found
 Top Related Tweet
No results found
 Top Related Dev.to Post
No results found
 Top Related Hashnode Post
No results found
Yes. have to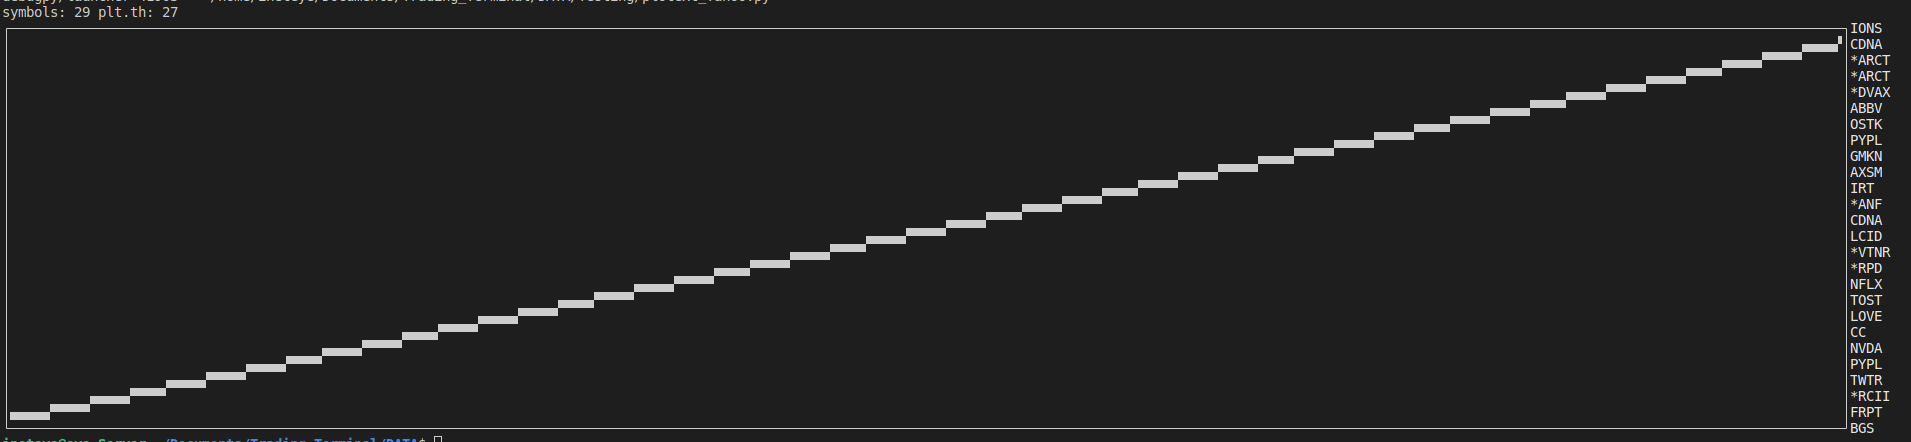
pip uninstall plotextand thenpip install git+https://github.com/piccolomo/plotextand finally it works 😉 Even if we have height smaller than array of symbolsHi @ineteye,
issue solved in new GitHub version. To install:
pip install git+https://github.com/piccolomo/plotext. Could you kindly double check?Here is my result:
I hope it helps and thanks for the report, it was very helpful to bust another issue as well.