
Lightrun Answers was designed to reduce the constant googling that comes with debugging 3rd party libraries. It collects links to all the places you might be looking at while hunting down a tough bug.
And, if you’re still stuck at the end, we’re happy to hop on a call to see how we can help out.
MB-MelGAN consumes a lot of memory while starting evaluation
See original GitHub issue(Issue opened after https://github.com/TensorSpeech/TensorFlowTTS/issues/354 as this appears to be a separate issue)
I am fine-tuning the multiband_melgan.v1_24k Universal Vocoder with command:
CUDA_VISIBLE_DEVICES=0 python examples/multiband_melgan/train_multiband_melgan.py \
  --train-dir ./dump_LibriTTSFormatted/train/ \
  --dev-dir ./dump_LibriTTSFormatted/valid/ \
  --outdir ./outdir/MBMELGAN/MBMelgan-Tune-Experiment1 \
  --config ./models/multiband_melgan.v1_24k.yaml \
  --use-norm 1 \
  --pretrained ./models/libritts_24k.h5
After 5000 steps it begins evaluation…
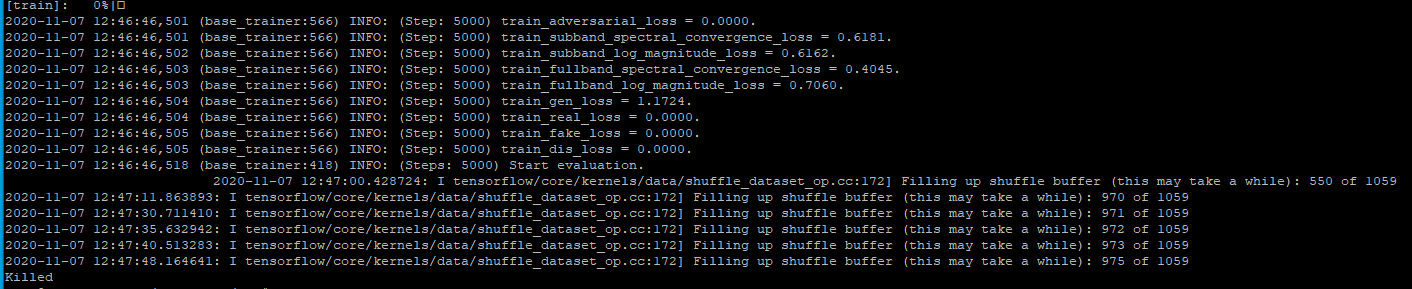
Sometimes it gets killed while filling the shuffle buffer. Sometimes it fills the buffer, but gets stuck in evaluation for some minutes before then getting killed.
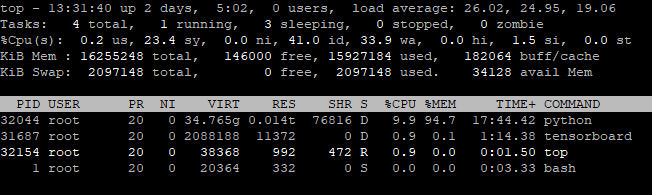
I put training into the background and entered top as I reached the Shuffle buffer filled stage. I noticed using SSH was extremely laggy and slow. (Probably because the system memory is full).
It says python is using almost 35GB of Virtual memory, ~15GB of RAM (the remaining RAM is full).
Issue Analytics
- State:

- Created 3 years ago
- Comments:5 (4 by maintainers)
 Top Related StackOverflow Question
 Troubleshoot Live Code
 Top Related Reddit Thread
 Top Related Hackernoon Post
 Top Related Tweet
 Top Related Dev.to Post
 Top Related Hashnode Post
As for debugging in headless SSH, should I try the TensorFlow Profiler? It seems to show a lot of memory usage details.
Wow, this is a really nice method, I will try this out in the future 😄