
Lightrun Answers was designed to reduce the constant googling that comes with debugging 3rd party libraries. It collects links to all the places you might be looking at while hunting down a tough bug.
And, if you’re still stuck at the end, we’re happy to hop on a call to see how we can help out.
Candlestick series does not update properly when resetting data
See original GitHub issueLightweight Charts Version: 1.2.1
Note: I saw this issue when updating from 1.1.0 to 1.2.1. I have reverted back to 1.1.0 to verify and could confirm it does not happen. I think that it’s a possible bug introduced in 1.2.1.
Steps/code to reproduce: Context: I have a button that lets the user switch timeframe for a given market.
Programmatically, the only thing I do is to call the candlestickSeries.setData(selectedTimeframeData).
The issue happens after I set the data.
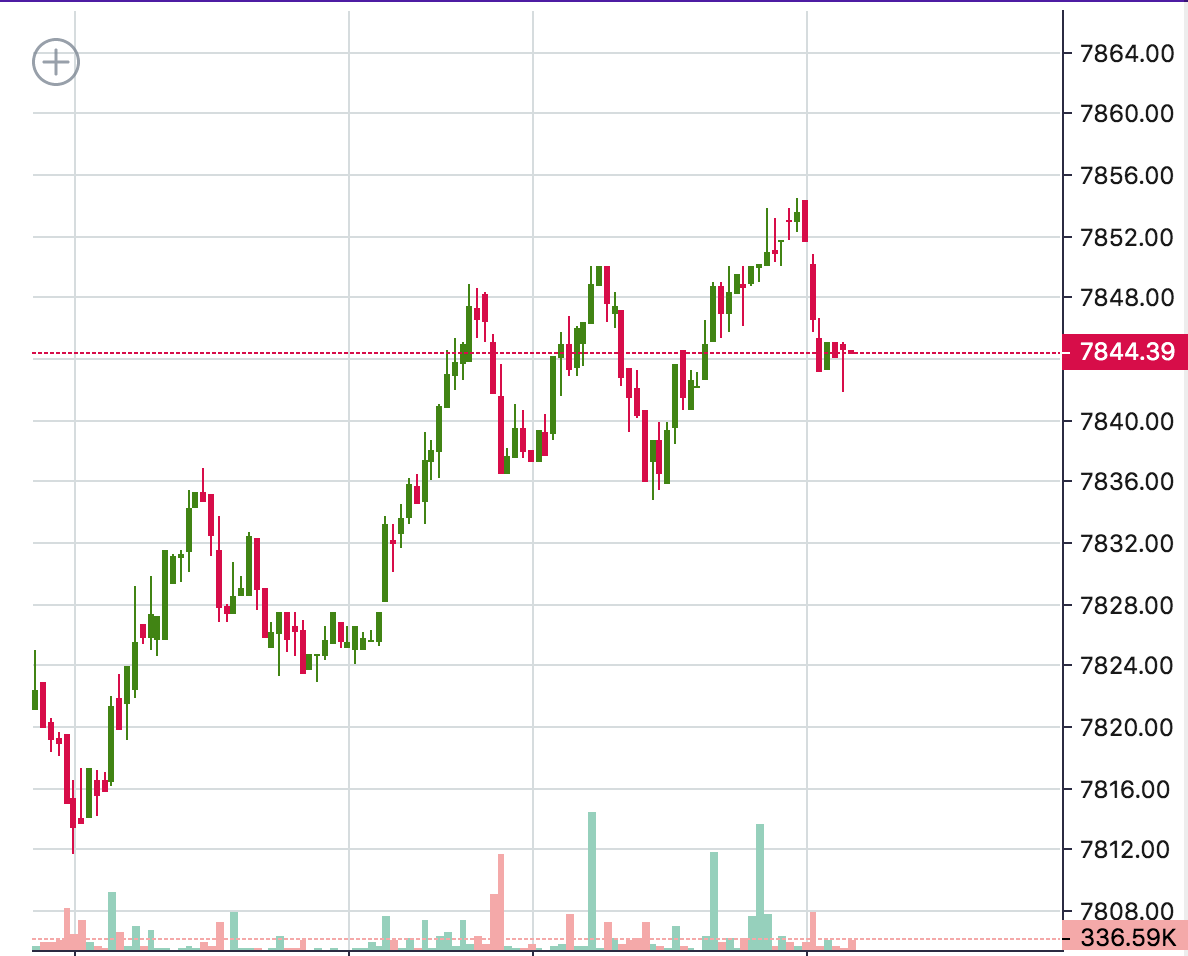
Actual behavior: The chart looks fine when I set the data for the first time:
First set of data for candlestick series
After setting new data in the serie (another timeframe)
I can scroll the chart horizontally and I have wrong candles painted in the “future”.
You can see on the half right of the chart, all these “weird candles” that should not be there. Note that also there is no date / time on the time axis for these.
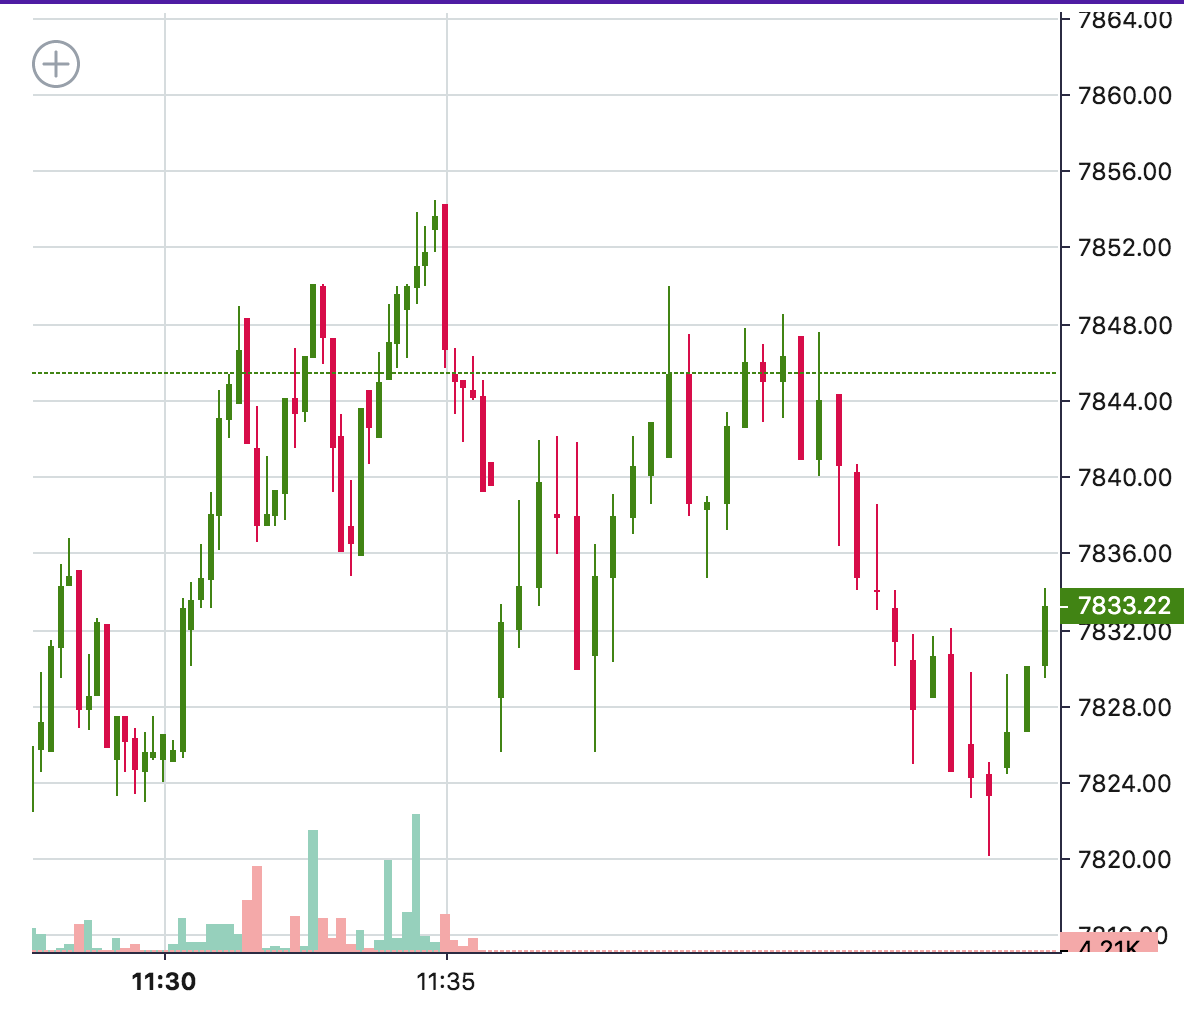
Expected behavior:
These unexpected candles, on the right, should not be there.
Issue Analytics
- State:

- Created 4 years ago
- Comments:5 (2 by maintainers)
 Top Related StackOverflow Question
 Troubleshoot Live Code
 Top Related Reddit Thread
 Top Related Hackernoon Post
 Top Related Tweet
 Top Related Dev.to Post
 Top Related Hashnode Post
Hello @timocov . Sorry, had been completely absorbed by my work. I’ll do something this week-end.
Will do as soon as I can.