
Lightrun Answers was designed to reduce the constant googling that comes with debugging 3rd party libraries. It collects links to all the places you might be looking at while hunting down a tough bug.
And, if you’re still stuck at the end, we’re happy to hop on a call to see how we can help out.
Trendline does not draw correctly when out-of-view
See original GitHub issueLightweight Charts Version: “lightweight-charts”: “^1.2.1”
Steps/code to reproduce: Not sure if this is considered a bug as this is a workaround for drawing trend-lines by overlaying two charts together.
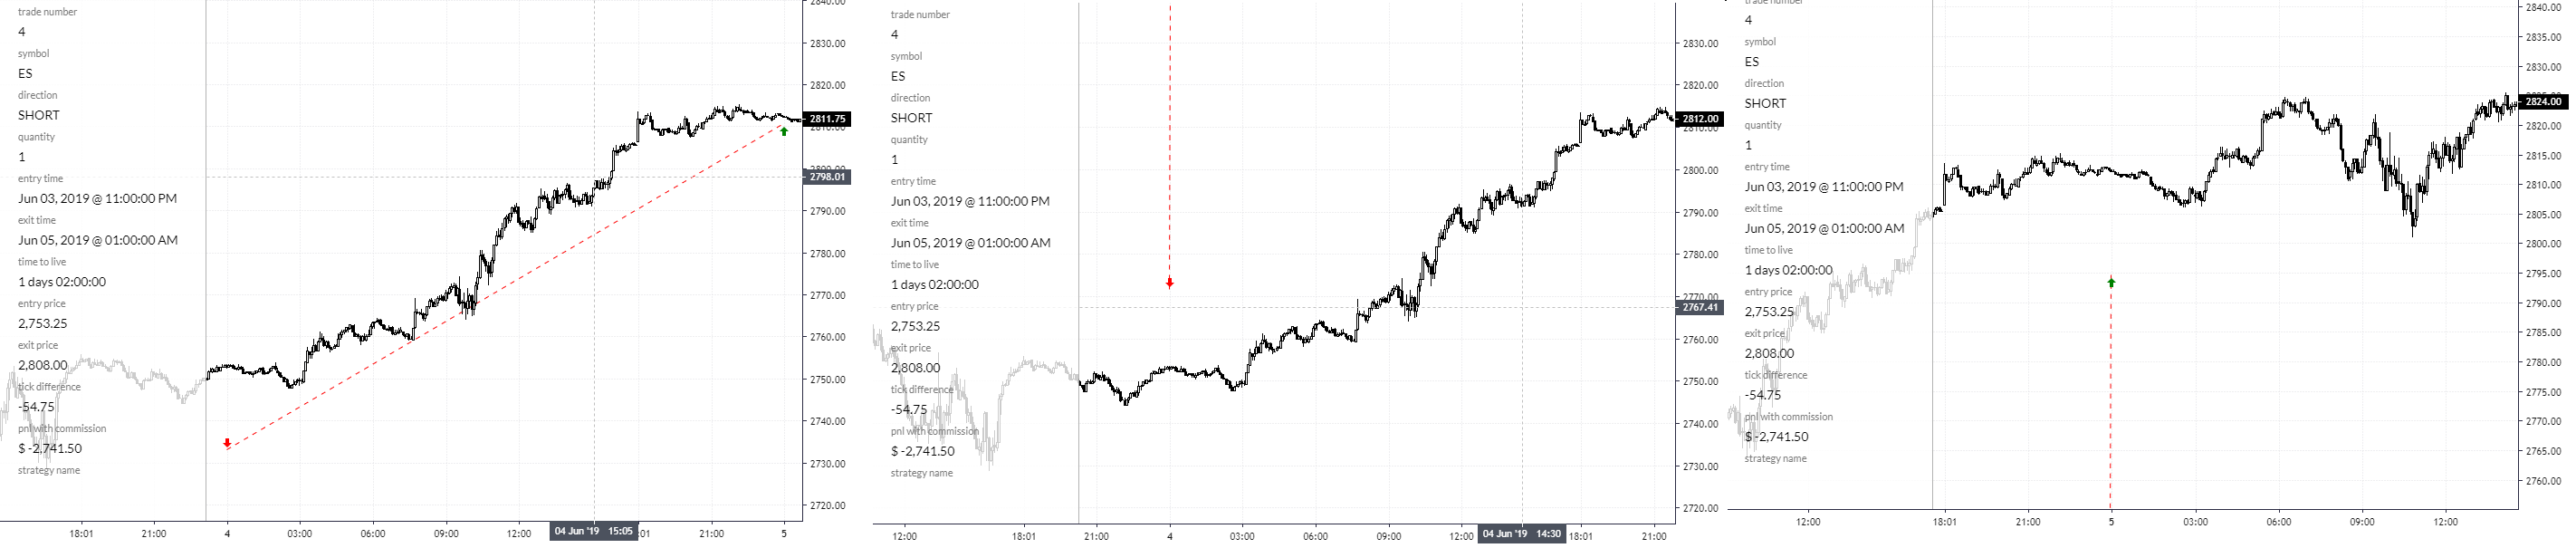
When either the start or end point pans out of view, the overlay addLineSeries behaves rather ugly
const trade_overlay = tradeReportChartOverlay(pnl_line_color)
trade_overlay.setData([
    {value: entry_price, time: epoch_entry_time},
    {value: exit_price, time: epoch_exit_time}
])
Actual behavior: Please see image below on the resulting behaviour
Expected behavior:
Ideally it should be able to draw the trend line accurately On a side note, is it possible to remove the overlay addLineSeries data in the event the either the start or end “time” is “out-of-view”
Screenshots
Issue Analytics
- State:

- Created 4 years ago
- Comments:5 (3 by maintainers)
 Top Related StackOverflow Question
 Troubleshoot Live Code
 Top Related Reddit Thread
 Top Related Hackernoon Post
 Top Related Tweet
 Top Related Dev.to Post
 Top Related Hashnode Post
the barSeries has the full OHLC data, where as the tradeDetailLineSeries is limited to two points (which is the start- and end-point of the trendline)
Sure, I’ll try to port over an example this afternoon
Closing.
This was an bug on my side; It looked like the underlying ohlc was drawn with UTC, while the Trendline was draw with EST… so the trendline sort of fell-off when out of viewpoint