
Lightrun Answers was designed to reduce the constant googling that comes with debugging 3rd party libraries. It collects links to all the places you might be looking at while hunting down a tough bug.
And, if you’re still stuck at the end, we’re happy to hop on a call to see how we can help out.
Source-level debugging
See original GitHub issueChecklist
- Did you write out a description of the feature you want to see?
- Did you look around for any related features?
- Did you specify relevant external information?
Feature Description
Debugging generated RTL from Firrtl with existing simulator environment is less appealing since there are layers of optimizations that obfuscates the RTL. Ideally users should write their design in Chisel and debug in the same environment, e.g. setting breakpoint at a particular line in Chisel and inspect the frame/context information once the breakpoint hits.
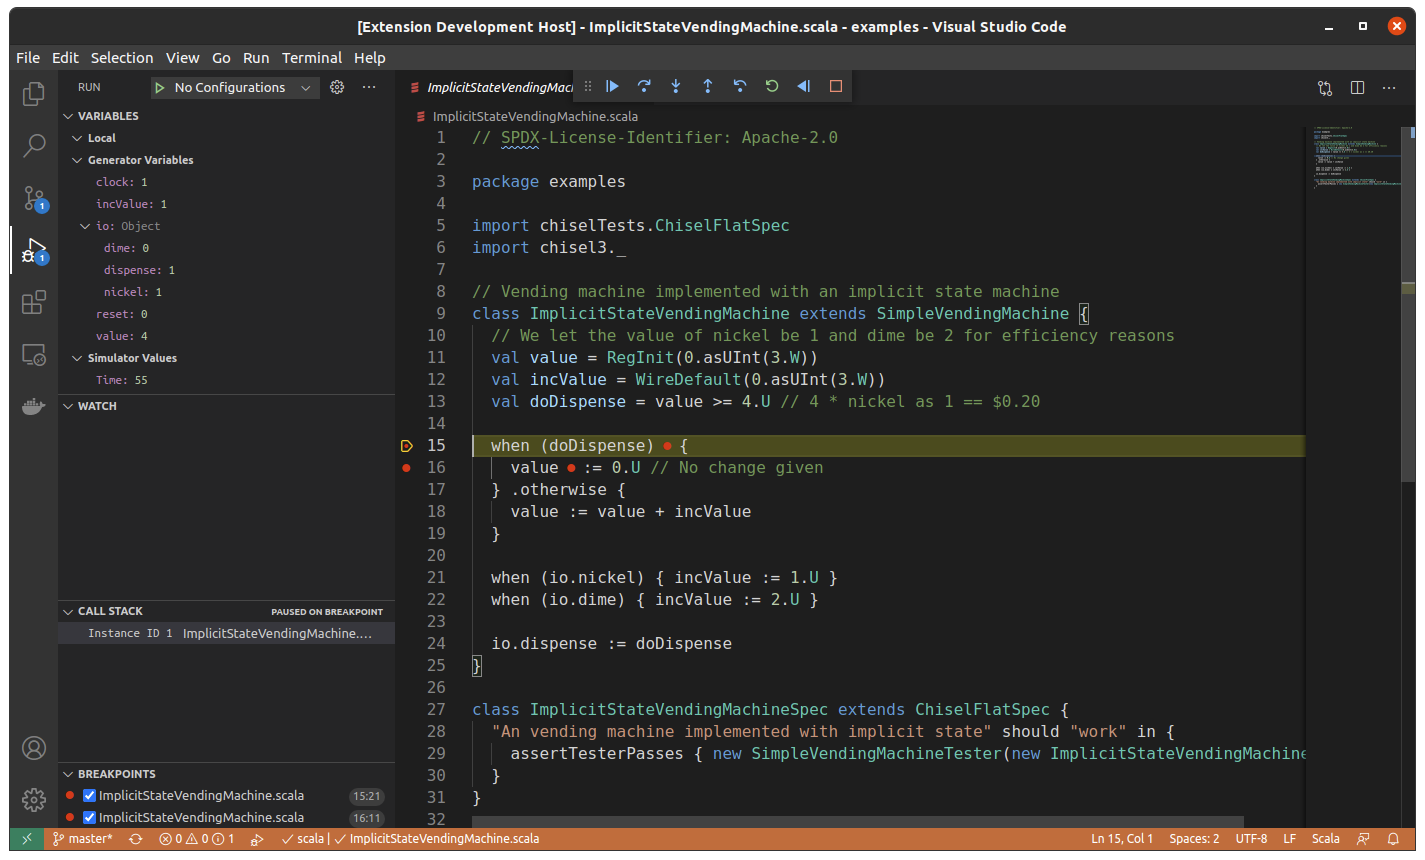
We have been working on a source-level debugging framework called hgdb, which is language and framework independent. With existing debugging information in Firrtl, we’ve built a proof-of-concept pass that extract the information from Firrtl and dump a symbol table for debugging. The figure below shows the debugging experience in Visual Studio Code:
Our proof-of-concept has many limitations and we’d like to request the following features from Firrtl:
- Keeping track of symbol changes. Currently there is no symbol table or symbol tracking in Firrtl. We made some assumptions on how complex data types are lowered into RTL, but this may not work in the future, if Firrtl changes naming convention. This is particular helpful to debug SSA-transformed code, since we need the renaming map to faithfully represent the logic. We’d like to request such feature to keep track of naming changes and keep the symbol table updated.
- There is no frame/context information stored in Firrtl. As a result, once a breakpoint hits, users will not see any “local” value informations. This is not high priority, since all the named signals are represented in the “Generator Variable” sections. However, this is important to debug meta-programmed circuit since elaboration tends to destroy such information and makes the RTL confusing.
-O0option. Because our pass only works onHigh FormIR before the mux pulling, a lots of symbols simply get optimized away when lowered to RTL, resulting in missing symbol when debugging the design. We’d like to request a flag that turn off all optimization passes, similar togcc’s-O0.
Type of Feature
- new feature/API
Related Features
None.
External Information
hgdb is a second-generation of debugging framework we’ve been working on. You can check out more details here:
- hgdb: https://github.com/Kuree/hgdb/
- hgdb-firrtl: https://github.com/Kuree/hgdb-firrtl
- hgdb-debugger: https://github.com/Kuree/hgdb-debugger
Please let me know if you have any comments or suggestions.
Issue Analytics
- State:

- Created 3 years ago
- Comments:9 (4 by maintainers)
 Top Related StackOverflow Question
 Troubleshoot Live Code
 Top Related Reddit Thread
 Top Related Hackernoon Post
 Top Related Tweet
 Top Related Dev.to Post
 Top Related Hashnode Post
I’m closing this for now since I got source-level debugging with Firrtl working in a decent shape. The video below shows debugging with rocket chip, which exercises step over and reverse debugging.
https://user-images.githubusercontent.com/6099149/136274006-f3d16f43-fc11-4e44-9c51-c051e3ff83eb.mp4
Thanks @mwachs5
We don’t have any plan right now but I’m happy to present! Please send me an email (keyi at cs.stanford.edu) with availability. I can also have my advisor (Mark Horowitz) involved if you think there is some potential to collaborate.