Observe Your Live Application — Straight From Microsoft Visual Studio
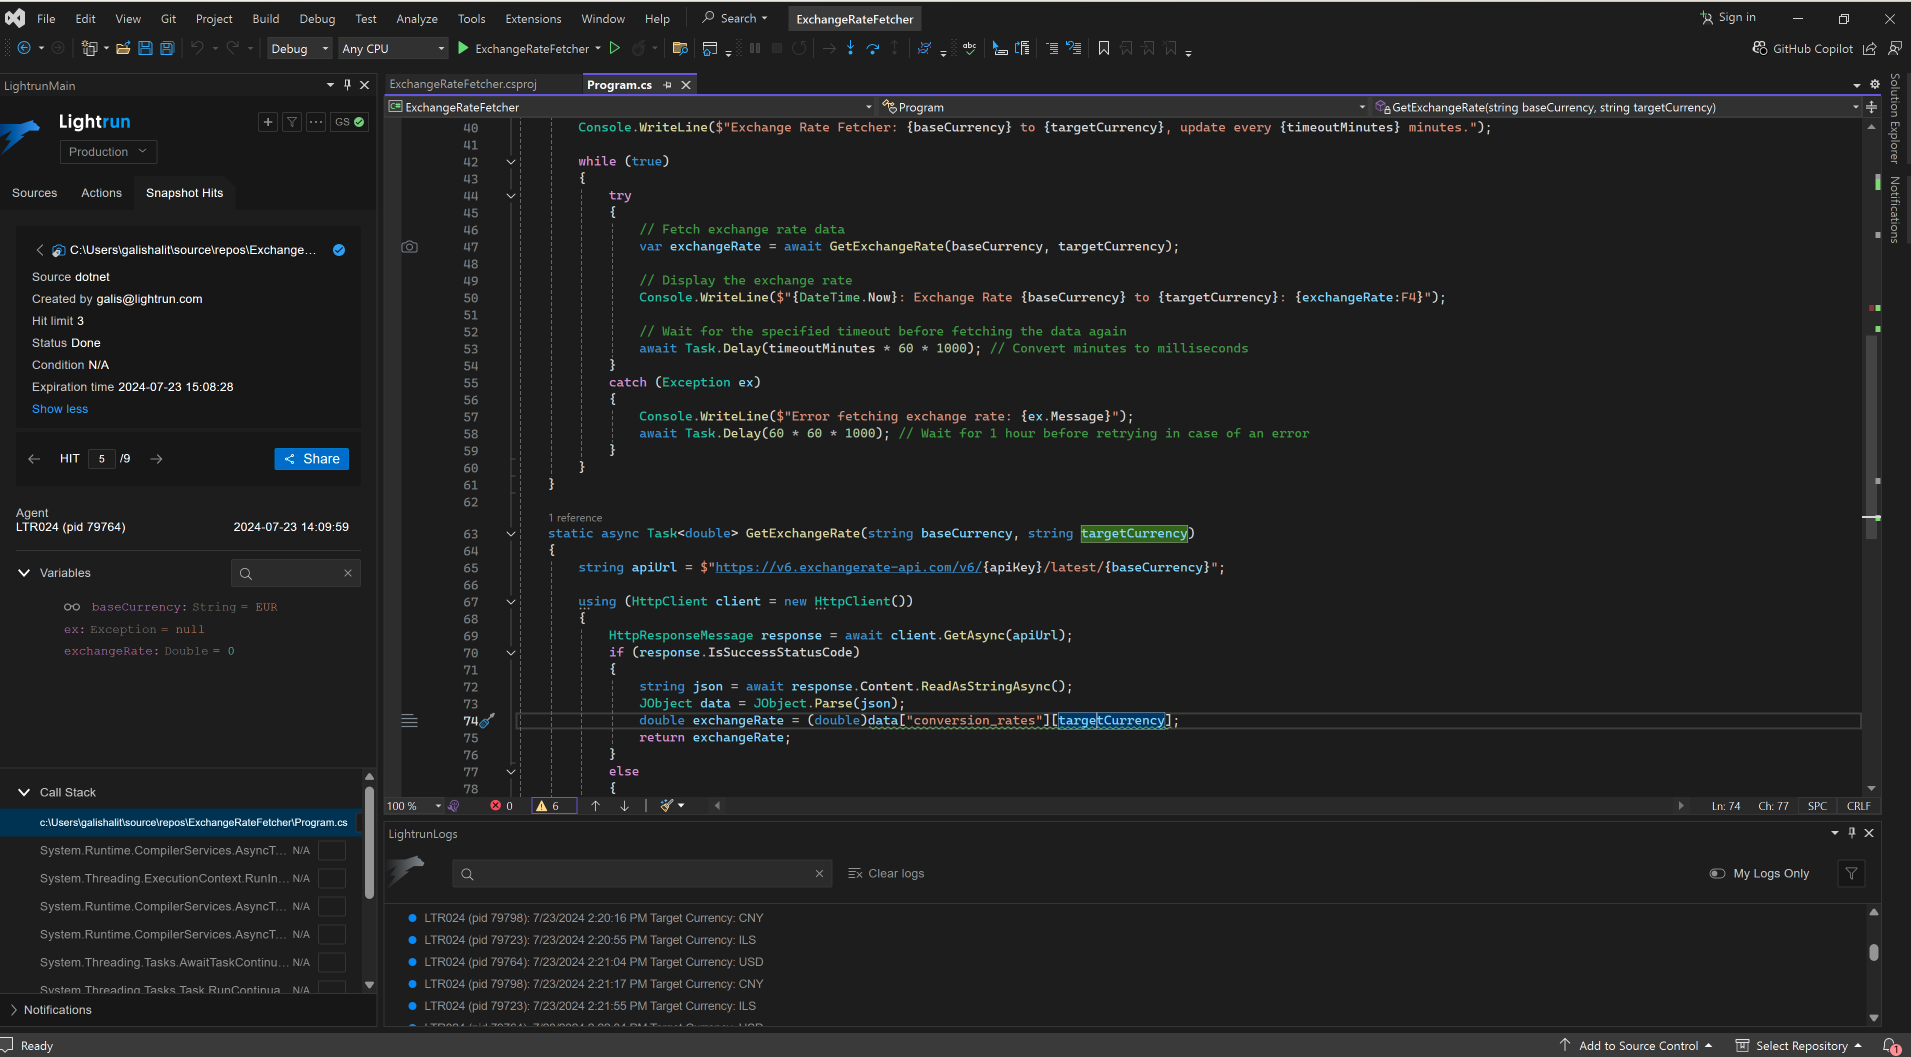
As part of Lightrun supported runtimes, users can troubleshoot .NET live applications written in C# directly from Visual Studio IDE which is the most comprehensive IDE for .NET and C++ developers on Windows.
Specifically, developers can utilize our context-aware IDE extension and troubleshoot applications on Windows OS to:
Developer Observability For .NET, .NET Core, and .NET Runtime in Microsoft Leading IDE
Developer time is precious and should be spent crafting creative code, not diving through endless logs, metrics and traces.
Lightrun is a developer observability platform that empowers you to understand anything that happens in a live application — all straight from your IDE.
- Dynamically Instrument Live Applications: On demand, in real time without stopping the application
- Never Leave The IDE: Pop the hood on your live application without moving away from your code
- Get What You Need, When You Need It: Lightrun’s console lets you see output in real-time with a dedicated view that enables analysis within VSCode.dev
- Troubleshoot in an enterprise grade security platform with SSO, role based access control (RBAC), and PII Redaction support.
Dynamically Instrument Your Live Applications

Lightrun enables you to perform dynamic instrumentation across all of your environments at the same time to debug them, inspect their state and troubleshoot difficult issues. Lightrun is:
- Deployment-Agnostic: Works in cloud-native applications, Kubernetes, serverless, and much more
- Supported Live Debugging Actions for C# & .NET: Add dynamic logs and snapshots (virtual breakpoints) at runtime and reduce the MTTR for your application incidents
- Available For All Environments: Debug local, staging, QA and production environments without a direct connection or networking hidden secrets
Get Started In Minutes
It’s easy to get started using Lightrun’s Developer Observability tools in Visual Studio. In just a few clicks you can ensure that you never have to leave the IDE to understand what’s going on in your application again!
To start using Lightrun in Visual Studio you should first download and install the Lightrun extension available on the Microsoft MarketPlace.
- Lightrun extension for Microsoft Visual Studio 2019
- Lightrun extension for Microsoft Visual Studio 2022
Next, please contact Lightrun through the Book a Demo form to setup an account for you to get started.
Lightrun IDE Plugins
Do you need to integrate other IDEs? We’ve got you covered.
- Support available for WebStorm, IntelliJ IDEA, PyCharm, VS Code and select web IDEs
- Support for more IDEs will be available soon
Dynamically Instrument Your .NET Live Applications
It’s easy to get started using Lightrun’s Developer Observability platform. Simply navigate to the Microsoft Visual Studio extensions and download the Lightrun IDE plugin.
To start using Lightrun in Microsoft Visual Studio IDE, follow the instructions from our documentation portal.
