Three Code Instrumentation Patterns To Improve Your Node.js Debugging Productivity
In this age of complex software systems, code instrumentation patterns define specific approaches to debugging various anomalies in business logic. These approaches offer more options beyond the built-in debuggers to improve developer productivity, ultimately creating a positive impact on the software’s commercial performance.
In this post, let’s examine the various code instrumentation patterns for Node.js. We will briefly touch upon the multiple practices for code instrumentation available within the Node.js ecosystem and cover three code instrumentation patterns for distinct debugging scenarios.
Essential Code Instrumentation Patterns for Node.js
Node.js has a rich ecosystem of tools, including debugging and libraries. As a Node.js developer, you have the following basic options to understand what your code is doing:
- Built-in inspector tools and clients to debug the Node.js source code.
- Telemetry SDK, such as the OpenTelemetry SDK, for embedding traces and logs within the Node.js source code.
The first option is an inherent code instrumentation technique of manually controlling the execution of the Node.js program based on certain pre-conditions. It resembles the old-fashioned way of debugging code using legacy programming languages like C.
The second option offers more flexibility, and that relies on three commonly used code instrumentation patterns:
- Pattern #1 – Tracing: used for capturing the internal call stack of the program at a given point of execution to get a deeper understanding.
- Pattern #2 – Debug Logs: used for capturing the program’s internal state during execution.
- Pattern #3 – Information Logs: used for capturing information messages to mark the normal progression of the program execution.
Let’s take a quick example to demonstrate the tracing code instrumentation pattern in a Node.js program. Tracing helps capture the deeper context of the program’s flow and data progression. Take a look at this sample Node.js script:
const os = require('os-utils');
const opentelemetry = require('@opentelemetry/api');
const {SemanticResourceAttributes} = require('@opentelemetry/semantic-conventions');
const {NodeTracerProvider} = require('@opentelemetry/sdk-trace-node');
const {ConsoleSpanExporter, BatchSpanProcessor} = require('@opentelemetry/sdk-trace-base');

const CALCULATION_DURATION = 300000; // Calculation duration in milliseconds (300 seconds)
const CPU_IDLE_THRESHOLD = 20; // CPU idle threshold (20%)
const CPU_OVERLOAD_THRESHOLD = 80; // CPU overload threshold (80%)
const MEMORY_IDLE_THRESHOLD = 20; // Memory idle threshold (20%)
const MEMORY_OVERLOAD_THRESHOLD = 80; // Memory overload threshold (80%)

const provider = new NodeTracerProvider({});
const exporter = new ConsoleSpanExporter();
const processor = new BatchSpanProcessor(exporter);
provider.addSpanProcessor(processor);

provider.register();
const tracer = opentelemetry.trace.getTracer();

function calculateAverageUsage(samples) {
    const sum = samples.reduce((total, usage) => total + usage, 0);
    return sum / samples.length;
}

async function getStats() {
    const stats = {
        memoryUsage: Math.floor(100 - (100 * os.freememPercentage())),
        cpuUsage: Math.floor(100 * (await new Promise(resolve => os.cpuUsage(resolve)))),
    };
    return stats;
}

console.log('Starting System Stats Sampling...');

const cpuSamples = [];
const memorySamples = [];
const startTime = Date.now();

const intervalId = setInterval(async () => {

    tracer.startActiveSpan('main', async (span) => {

        let sysStats = await getStats();

        cpuSamples.push(sysStats.cpuUsage);
        memorySamples.push(sysStats.memoryUsage);

        span.addEvent('STAT_CAPTURE', {
            'cpuUsage': sysStats.cpuUsage,
            'memoryAvailable': sysStats.memoryUsage
        });

        span.end();

    });

    const elapsedTime = Date.now() - startTime;

    if (elapsedTime >= CALCULATION_DURATION) {
        const averageCPU = calculateAverageUsage(cpuSamples);
        const averageMemory = calculateAverageUsage(memorySamples);

        console.log('Calculation duration reached!');
        console.log('Average CPU usage:', averageCPU);
        console.log('Average memory usage:', averageMemory);

        if (averageCPU < CPU_IDLE_THRESHOLD) {
            console.log('Warning: Average CPU usage fell below the idle threshold!');
        } else if (averageCPU > CPU_OVERLOAD_THRESHOLD) {
            console.log('Warning: Average CPU usage exceeded the overload threshold!');
        }

        if (averageMemory < MEMORY_IDLE_THRESHOLD) {
            console.log('Warning: Average memory usage fell below the idle threshold!');
        } else if (averageMemory > MEMORY_OVERLOAD_THRESHOLD) {
            console.log('Warning: Average memory usage exceeded the overload threshold!');
        }

        clearInterval(intervalId);
    }
}, 1000);
This Node.js script runs for a predefined time and captures the system statistics of a computer in the form of CPU utilization and available memory percentages. These statistics are captured over a period of time and averaged to detect possible anomalies in the form of low or high values for the percentages.
The above code also includes a snippet of OpenTelemetry SDK and creates a tracer to add custom events for capturing the system statistics. This tracer is initialized through a NodeTracerProvider, and the event is captured inside a span.
…
…

const provider = new NodeTracerProvider({});
const exporter = new ConsoleSpanExporter();
const processor = new BatchSpanProcessor(exporter);

provider.addSpanProcessor(processor);
provider.register();

const tracer = opentelemetry.trace.getTracer();

…
…

tracer.startActiveSpan('main', async (span) => {
    let sysStats = await getStats();
    cpuSamples.push(sysStats.cpuUsage);
    memorySamples.push(sysStats.memoryUsage);
    span.addEvent('STAT_CAPTURE', {
        'cpuUsage': sysStats.cpuUsage,
        'memoryAvailable': sysStats.memoryUsage
    });

    span.end();

});
To run this Node.js program and generate traces, you can perform the following steps (tested on Node version 16 and above):
- Create a new Node.js project and install the following OpenTelemetry packages:
npm init -y npm install @opentelemetry/api @opentelemetry/semantic-conventions @opentelemetry/sdk-trace-node - Save the above code as app.js.
- Run app.js:
node app.js
Upon running, you should see the trace snapshots with the event that captures the CPU and memory percentages every few seconds:
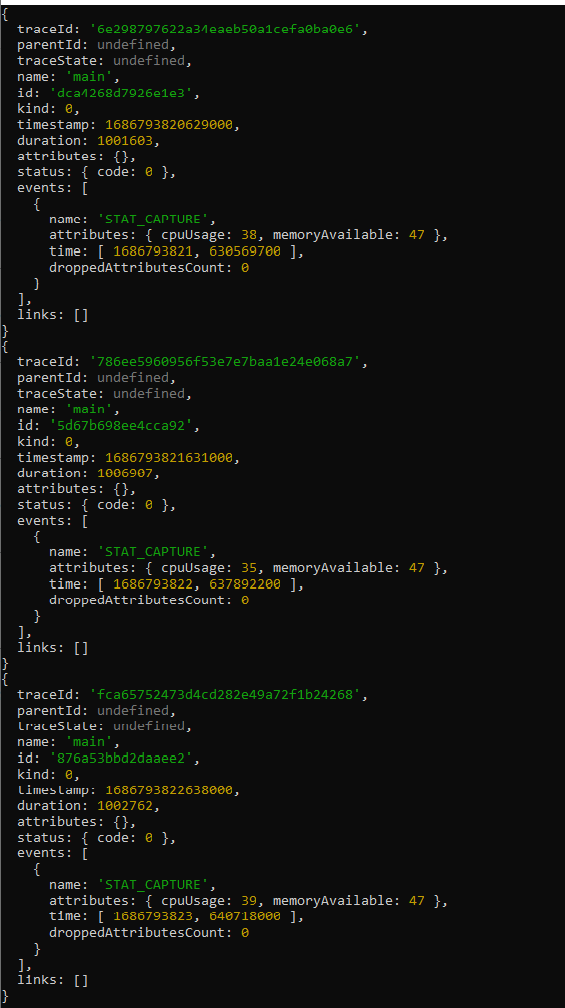
So far, so good. But now, if you want to capture more such trace snapshots in some other part of the code, you must create additional spans and define the events within. This involves code changes, rebuilds, and restarts of the program. This method of achieving code instrumentation is known as static instrumentation.
While static instrumentation is suitable for certain occasions when the software is under development, there are better ways for instrumenting code running in production. Production applications require live debugging without interruptions or downtimes, which can only be achieved through dynamic code instrumentation.
Enabling Dynamic Code Instrumentation in Node.js
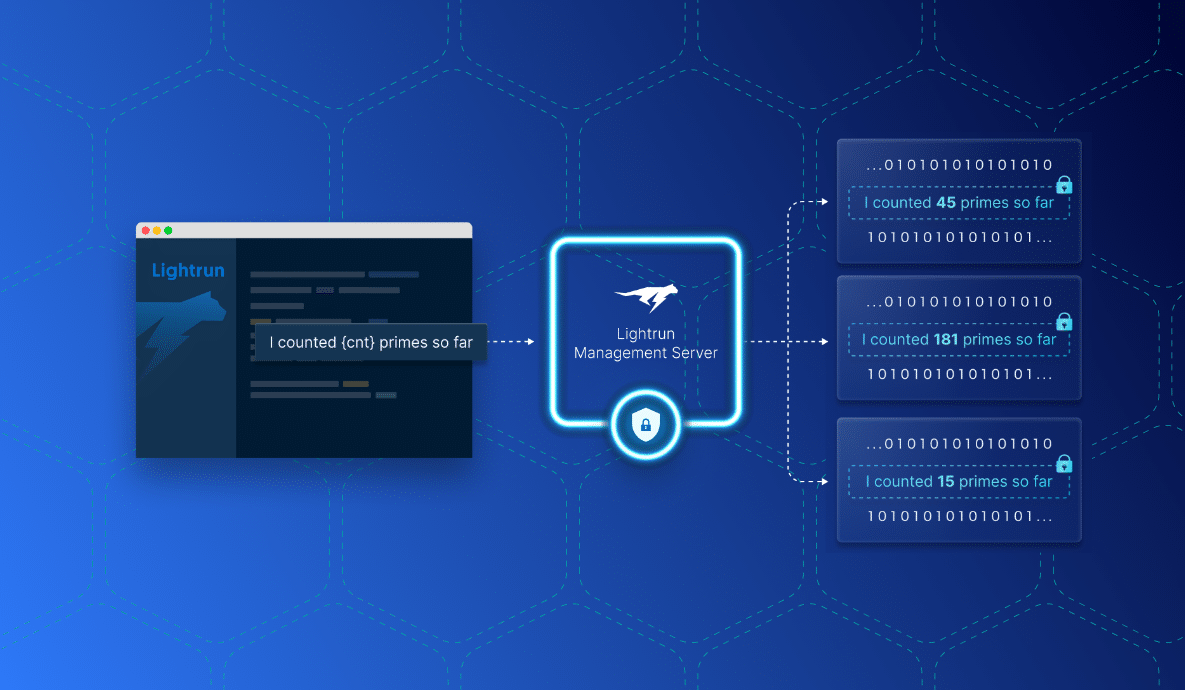
Dynamic code instrumentation enables developers to observe live running software without worrying about source code modification or runtime interruptions. In the case of Node.js, there is no way to provision dynamic code instrumentation natively. However, a platform such as Lightrun can achieve it with minimal overheads.
Lightrun is ideally suited for dynamic code instrumentation because it allows developers to provision instrumentation code from the IDE. Thus, developers can work within the familiar environment of their chosen IDE for developing, debugging, and continuously observing the code.
Set Up Dynamic Instrumentation in the IDE
Let’s take a deep dive into the world of dynamic instrumentation. By combining Lightrun with the popular Visual Studio Code IDE, you can leverage all three patterns on a Node.js program. To achieve that, first, you have to sign up for a Lightrun account and follow the steps provided post signup to choose your IDE to install the Lightrun plugin. In the case of Visual Studio Code, the Lightrun plugin appears on the sidebar:
Copy and paste the following Node.js program into the Visual Studio Code editor:
const os = require('os-utils');
require('lightrun').start({
lightrunSecret: '<LIGHTRUN_SECRET>',
});
const CALCULATION_DURATION = 300000; // Calculation duration in milliseconds (30 seconds)
const CPU_IDLE_THRESHOLD = 20; // CPU idle threshold (20%)
const CPU_OVERLOAD_THRESHOLD = 80; // CPU overload threshold (80%)
const MEMORY_IDLE_THRESHOLD = 20; // Memory idle threshold (20%)
const MEMORY_OVERLOAD_THRESHOLD = 80; // Memory overload threshold (80%)
function calculateAverageUsage(samples) {
const sum = samples.reduce((total, usage) => total + usage, 0);
return sum / samples.length;
}
async function getStats() {
const stats = {
memoryUsage: Math.floor(100 - (100 * os.freememPercentage())),
cpuUsage: Math.floor(100 * (await new Promise(resolve => os.cpuUsage(resolve)))),
};
return stats;
}
console.log('Starting System Stats Sampling...');
const cpuSamples = [];
const memorySamples = [];
const startTime = Date.now();
const intervalId = setInterval(async () => {
let sysStats = await getStats();
console.log("Current System Stats - ", sysStats);
cpuSamples.push(sysStats.cpuUsage);
memorySamples.push(sysStats.memoryUsage);
const elapsedTime = Date.now() - startTime;
if (elapsedTime >= CALCULATION_DURATION) {
const averageCPU = calculateAverageUsage(cpuSamples);
const averageMemory = calculateAverageUsage(memorySamples);
console.log('Calculation duration reached!');
console.log('Average CPU usage:', averageCPU);
console.log('Average memory usage:', averageMemory);
if (averageCPU < CPU_IDLE_THRESHOLD) {
console.log('Warning: Average CPU usage fell below the idle threshold!');
} else if (averageCPU > CPU_OVERLOAD_THRESHOLD) {
console.log('Warning: Average CPU usage exceeded the overload threshold!');
}
if (averageMemory < MEMORY_IDLE_THRESHOLD) {
console.log('Warning: Average memory usage fell below the idle threshold!');
} else if (averageMemory > MEMORY_OVERLOAD_THRESHOLD) {
console.log('Warning: Average memory usage exceeded the overload threshold!');
}
clearInterval(intervalId);
}
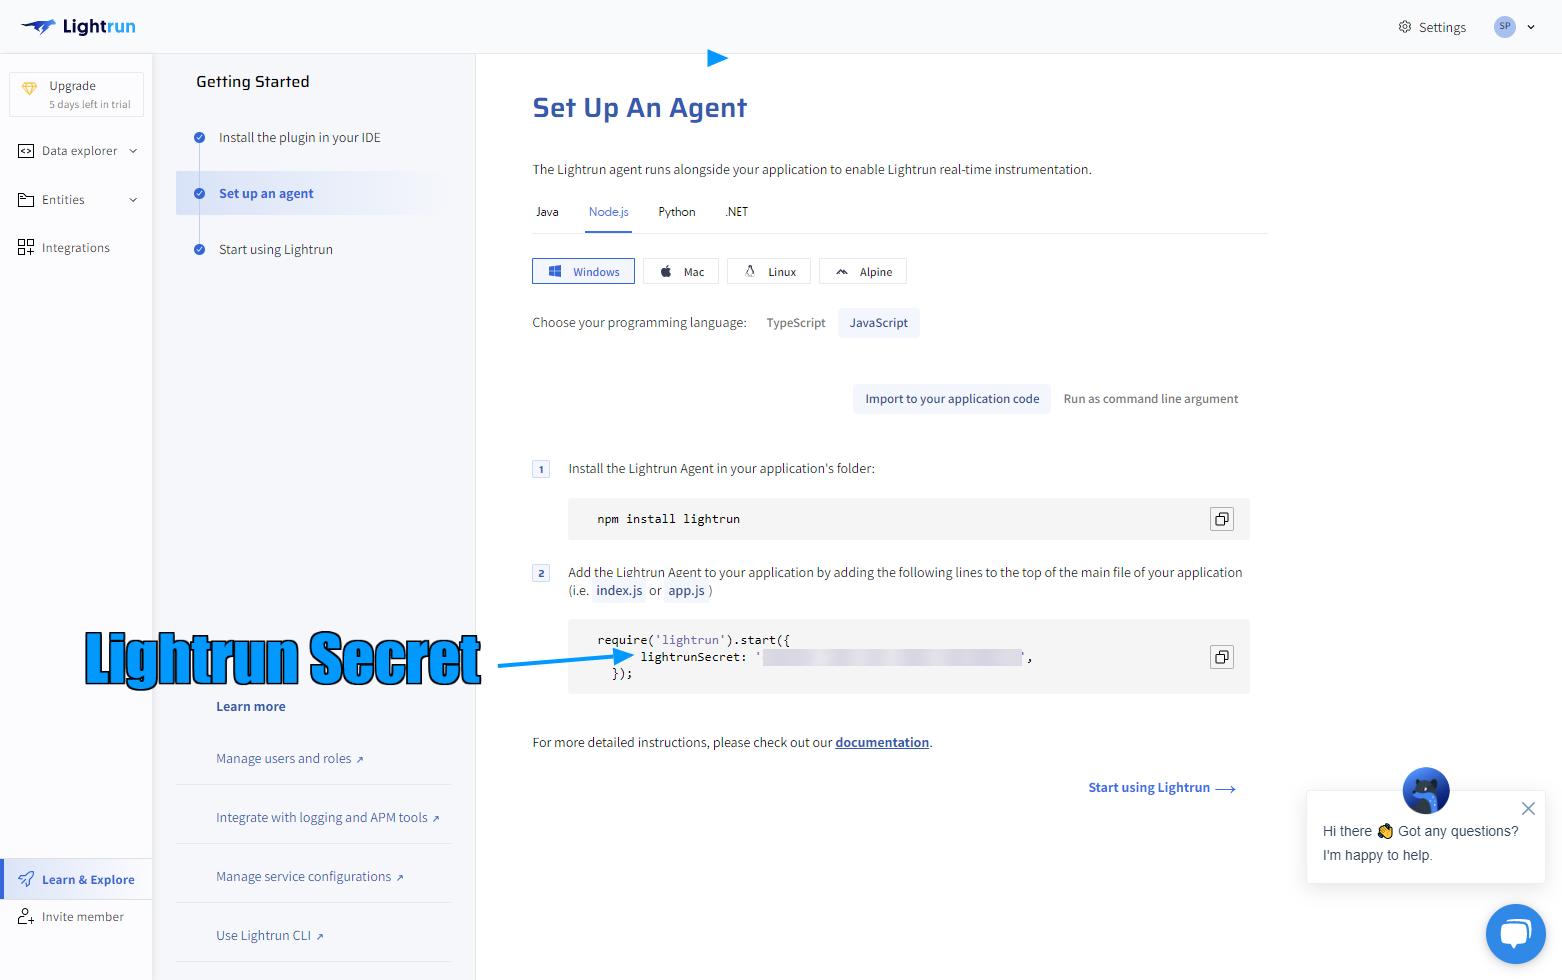
}, 1000);This is the same script used for capturing system stats earlier. However, now the OpenTelemetry SDK related code is removed. The only notable addition is the import of the Lightrun agent with the secret, which is specific to your account. So you must replace the placeholder <LIGHTRUN_SECRET> with your Lightrun account secret. You can find your account-specific Lightrun secret within the management console under the Set Up An Agent section:
Open a terminal and create a new project directory. Perform the following steps to create a new Node.js project and install the Lightrun agent via npm:
npm init -y

npm install lightrun
Also, ensure the above Node.js code is saved within the project directory.
Now, run the program:
node app.jsThis should start printing out the captured system stats on the console.
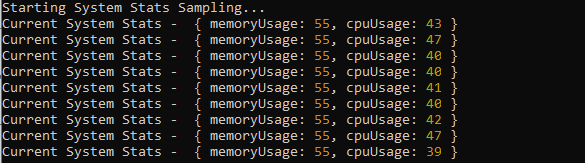
However, the real fun awaits us when we actually start to perform dynamic instrumentation in Visual Studio Code.
Harnessing the Power of Dynamic Instrumentation for Node.js Debugging
Let’s switch to Visual Studio Code to instrument the code using the three patterns.
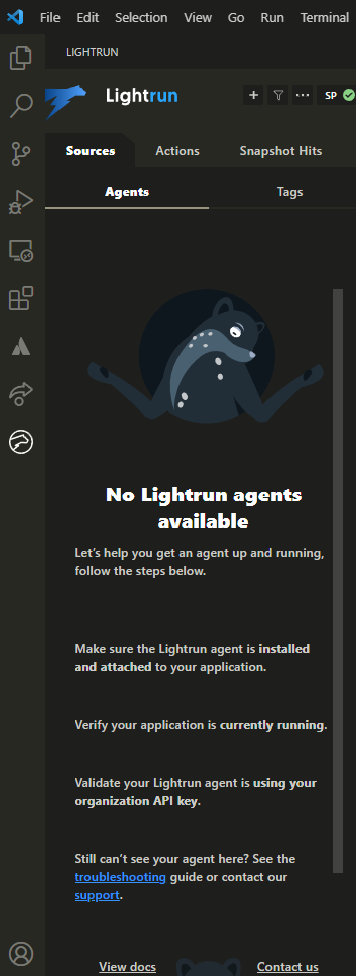
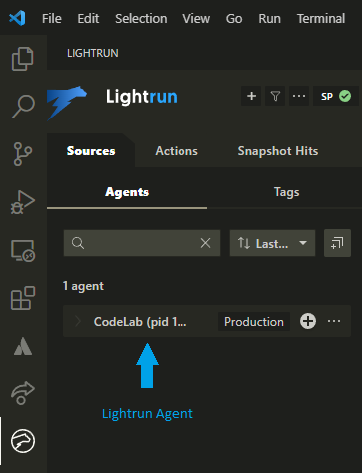
Once the program is running, you should see an updated Lightrun panel in Visual Studio Code with a Lightrun agent that is now running within the Node.js program:
Adding Snapshots to Trace the Program Context
With Lightrun, you can create dynamic snapshots at different places to trace the internal state of the running program. Think of snapshots as breakpoints that don’t stop your program’s execution. Right-click on the code line where you want to generate the snapshot, select Lightrun from the context menu, and choose to add a snapshot. Subsequently, when that line of code is executed, you can see the snapshot in the Lightrun panel to examine the current call stack.
Adding Debug Logs to Print Variables
Through the Lightrun context menu, you can add a debug log. For example, let’s add a log statement to capture the historical CPU samples stored in the array:
Adding Information Logs to Track the Execution Progress
Finally, you can follow the same steps to add an information log. Here is how you can add a simple information log to indicate the capture of individual system stats, along with a timestamp:
With Lightrun, there are infinite possibilities to instrument any Node.js program. Snapshots and logs are the main actions you can dynamically add anywhere in the code and remove at will. It is also possible to have multiple logs in the same code line.
If you want to enable dynamic code instrumentation in your Node.js application, go ahead and create your Lightrun account to get a free 14-day trial.
Also, do check out the docs section to get a head start on all the Lightrun features across different programming languages and IDEs.

It’s Really not that Complicated.
You can actually understand what’s going on inside your live applications.