Extending CI/CD with Continuous Observability & Debugging
Nov 17, 2020
This post is a recap of a joint webinar we held with JFrog – you can watch the on-demand recording here.
At The Phoenix Project – a whimsical journey through the eyes of an imaginary corporation’s IT leader’s day-to-day life – a large production issue is encountered in the deployment of the company’s flagship Phoenix project. This project, already behind schedule and over budget, is one of the focal points for the company’s CEO – who is very adamant that the catastrophe can be mitigated and the deployment finished promptly.
The narrator, Bill, is obviously under a tremendous amount of pressure to get the show on the road. But – being a seasoned veteran with a penchant for proper processes – he spends the majority of the rest of the book attempting to implement a saner operational schedule for the department.
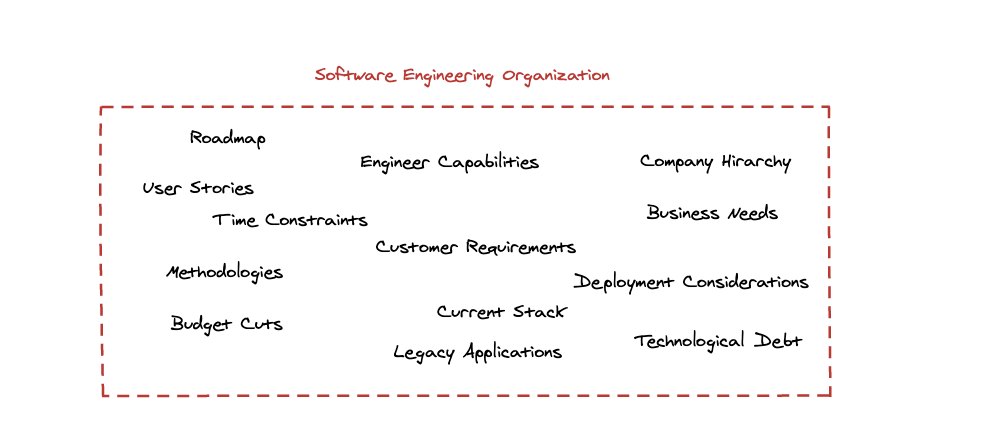
This book is a great story-like representation of what it’s like to build software nowadays. The tension at multiple levels of the company’s hierarchy, an assortment of project leaders, methodologies and deployment environments, external customer pressure – all of these and more are part of a day’s work for any company with a large-enough software development organization (the number of which is increasing rapidly as more and more processes start revolving around software).
It’s interesting to explore what we – as engineers and engineering leaders – have been doing in order to ensure that catastrophes like the one depicted earlier do not repeat themselves with every new version launch. As a discipline, software engineering has made leaps and bounds – infrastructure-wise – since the days of extremely costly dedicated servers in on-prem data centers. It’s cheaper and faster than ever to get your application into production by signing up to a cloud provider, defining your required resources and topology, and clicking a button or running a command to deploy.
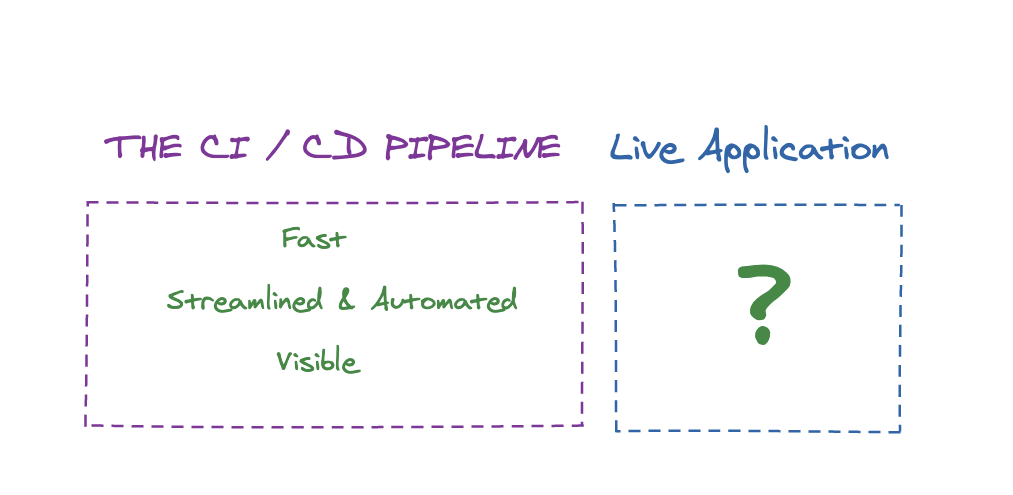
This increased agility is not limited to the hardware that we run our software on and to the basic software components we use to scaffold our applications – the process side of things has drastically improved as well. We now have full-fledged, mostly automated processes, around getting software from development to production – “The CI/CD Pipeline” – that makes sure that every piece of software is cared for on every front before reaching the customer’s eyes. In addition, these processes ensure that the entire workflow is faster, more reliable and less fragmented.
But, the value our software brings is only measured when it reaches the hands of our users – i.e. when it hits production. Software can only truly be evaluated by the effect it leaves on the daily lives of our customers, and as such – we need to make sure that the same agility is extended to the “right”-hand side of the SDLC – into the frontier of production environments.
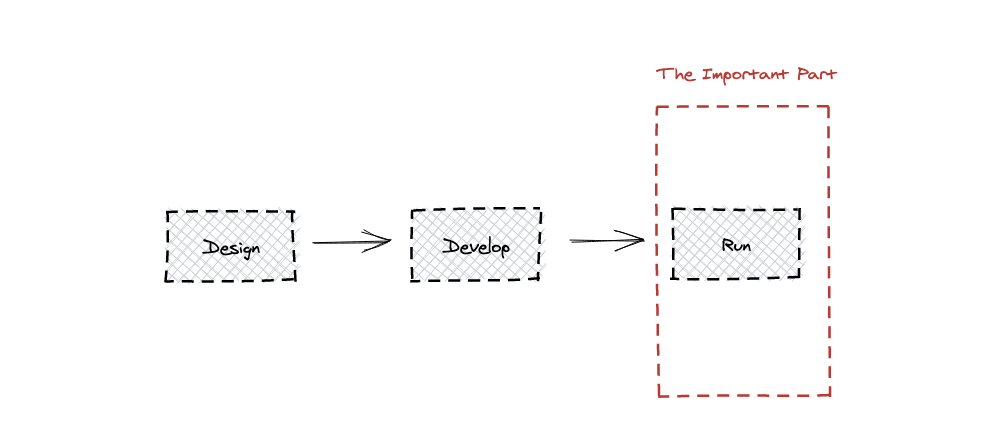
Before we dive into how to make sure the processes in our production environments are as streamlined as the ones earlier in the process, let’s first take a closer look at the earlier steps our software takes before it’s released into the wild.
Early Stage Agility
Getting a piece of software from development to production entails, roughly, the following stages:

-
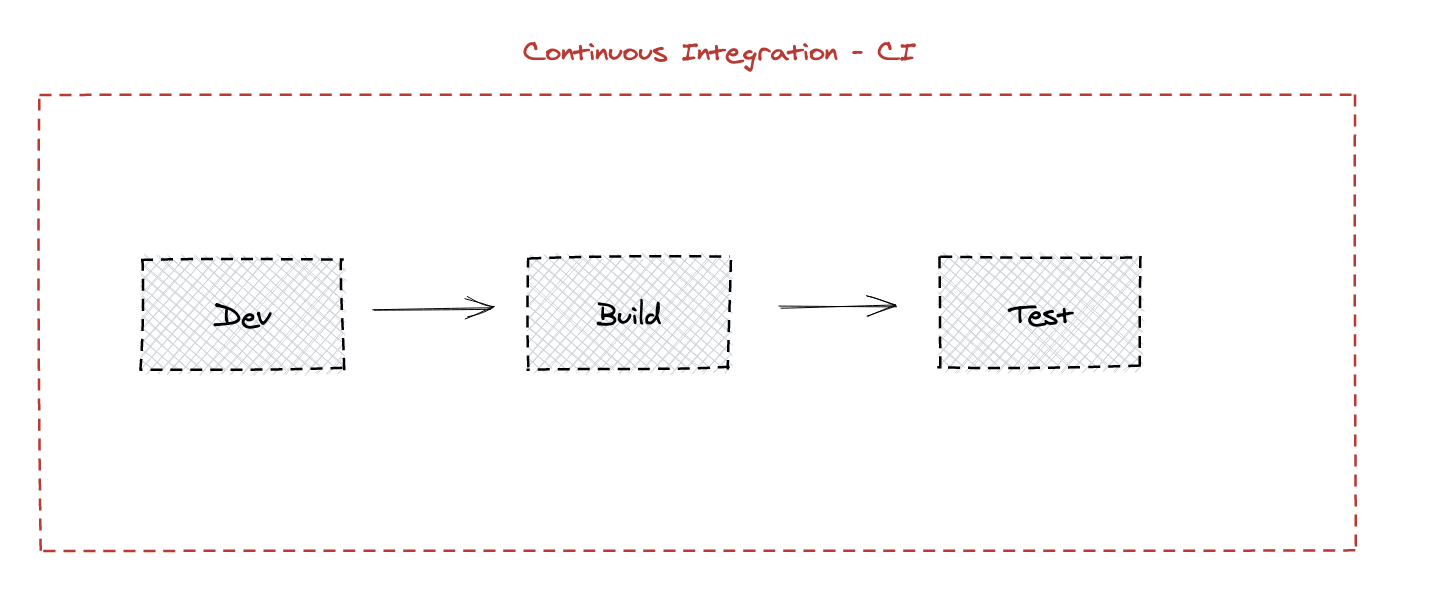
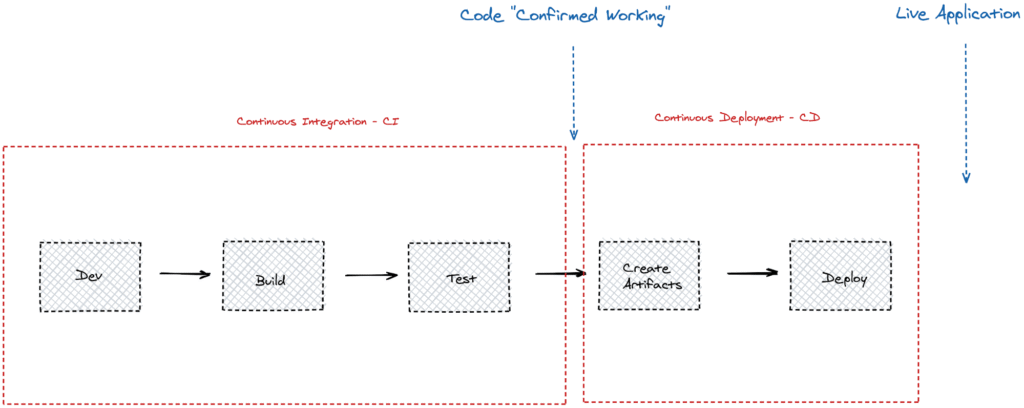
- Development – Source code is written into a source code repository – usually using a VCS (Version Control System) like Git. The main codebase is often hosted on a centralised repository on either a managed service or an on-prem solution, which acts as a single source of truth (SSOT) for the application versions and as a remote backup. This allows for multiple participants to simultaneously develop, with the final codebase always synchronized from one place.
- Build – In order to make sure the software functions properly, a build process that sets up the environment, fetches all the necessary dependencies and builds the final application is performed.
- Testing – Before code can actually be added into the centralised location (known as “integration” of the new code), a test suite is executed against it to ensure compatibility with the existing codebase.
This continuous addition of new code to the codebase following the build and test phases is often referred to as CI – Continuous Integration – and the machines that host the endeavour are often colloquially referred to as “CI Servers” (or, in some places, simply as “Build Servers”).
Once the code is “confirmed working” following the test suites, it needs to be prepared for deployment and then deployed to production:
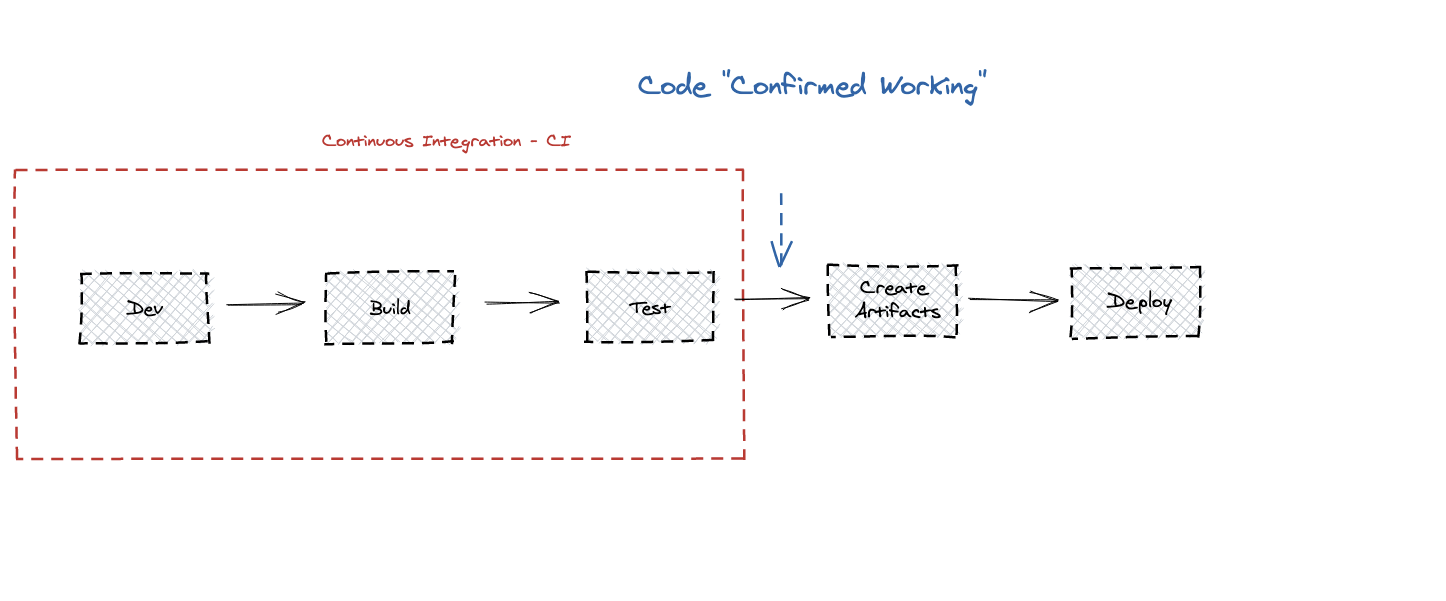
- Creating Artifacts – In a world with hundreds of different deployment targets including VMs, containers, Kubernetes pods, serverless functions, bare metal servers and others, creating the artifacts and the related configuration and metadata can be quite an ordeal. This endeavor gets even more tiresome if you are not working with a monolith application but in a distributed microservices architecture, where every release is composed of dozens (and sometimes hundreds) of different types of artifacts – one for each service.
- Deploying Artifacts – Once the artifacts are created, we also need to get them to the production machines. This usually entails communicating with the target platforms to announce the arrival of the new version, and waiting for confirmation of a successful deployment.
This latter part of the process, when conducted automatically, is often referred to as Continuous Deployment – or CD.
There are, however, quite a lot of other concerns that we’ve glided over so far. These issues are integral to the process and the software shouldn’t be deployed without them in place, including (but not limited to):
- Dependencies – relevant dependencies are not hosted on the source code repository next to our application, and as such need to be fetched during the build process from external sources (MavenCentral is an example for JVM development). These external sources must host the correct version and deliver it reliably – both of which are notorious pitfalls that often stop a build from finishing successfully.
- Security – the vulnerabilities of the underlying dependencies – and of the application itself – must be verified before deploying to production. This is usually done by scanning the dependencies of the application against an external vulnerability database (both on the binary and metadata levels) and the various components of the application itself.
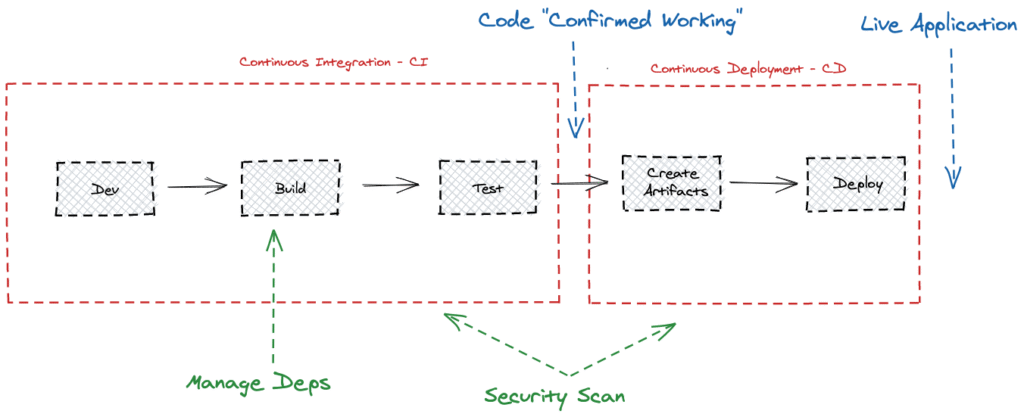
These steps used to be carried out by a member of the engineering team, or – in companies with more resources – by a dedicated systems or production engineer. These processes are repetitive, time-intensive, and prone to error when done manually, making them all prime candidates for automation.
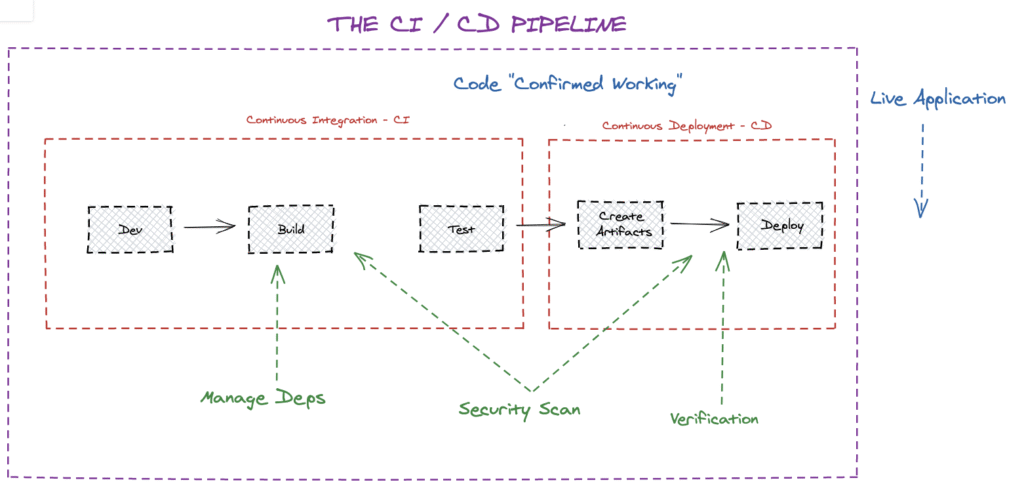
And, indeed, the automation of these processes constitutes a large portion of the tooling of most modern software organizations. The sequential execution of them on the dedicated infrastructure is often referred to as the “CI/CD Pipeline” mentioned earlier, due to the incremental nature of the “flow” of the application from source code to a deployed artifact.
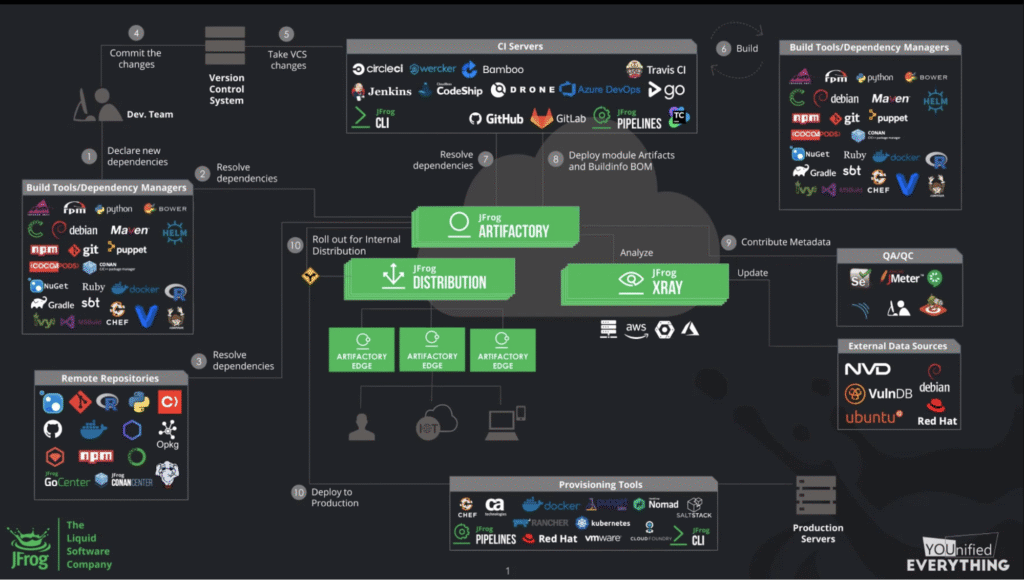
JFrog Artifactory is one example of a solution that can handle the process of artifact management for you -. Instead of relying on external artifact repositories and manual transfer of the software from one host to the other, JFrog Artifactory allows for automated promotion of artifacts between so-called “Artifactory Repositories”.
As your artifacts “mature” throughout the pipeline – passing more and more of the processes mentioned above, and moving between various environments – Artifactory can automatically promote them to the next level. This allows for the pipeline to really “flow” based on triggers from previous stages, instead of relying on human input for things that can be checked by a machine.
If you’re looking for an overarching solution, something that ties all the pieces together under a single roof you can use JFrog Pipelines which allows you to orchestrate and automate every single step your application needs to take before being deployed into production.
JFrog Pipelines coordinates all the existing tools that automate the processes mentioned above – including security scanning using JFrog XRay and artifact caching using JFrog Artifactory – to provide a more wholesome experience for software organizations that need to keep on shipping.
The diagram below gives a great overview of how the different JFrog services fit together.
The Need For Production Agility
By now, we’ve established that there’s a need for agility on the way from development to production. We’ve also looked at a couple of solutions that offer automation and orchestration for significant pieces of the puzzle.
These advancements, along with a growing appreciation for the complexity of the process of developing software and the care it takes for doing it right – has created a world in which getting our software to production is a fast and streamlined process, enabling quicker updates and a better user experience.
And, when something inevitably breaks, it’s usually very easy to track the specific point of failure, make a change immediately, and re-trigger the exact step that failed without going through the full pipeline because of that single problem. Every step along the way is triggered automatically based on the previous step, is extremely visible and thus easy to audit from all angles and can be modified using the command line, user interfaces and APIs.
But what goes on after the pipeline ends? What happens when our software is released into production?
Going back to The Phoenix Project for a second, the narrator says to the other stakeholders at his department the following line during a specifically difficult portion of the project deployment:
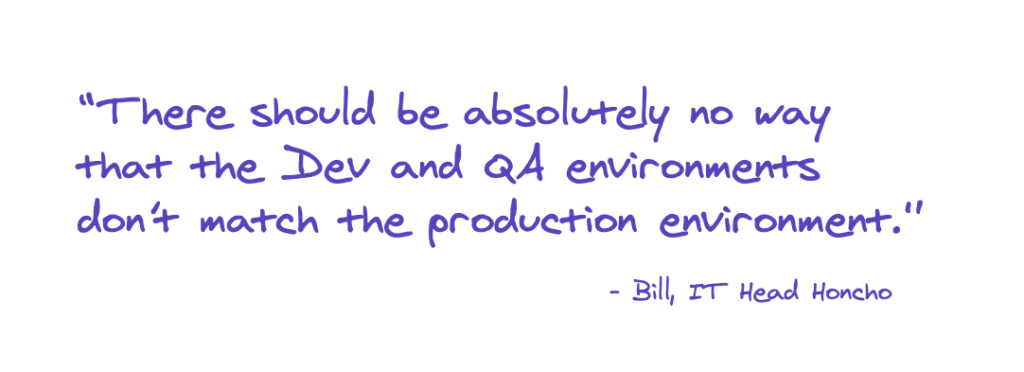
The issue is, unfortunately, that it is almost always impossible to match the environments exactly. There are just too many factors to take into consideration – for example:
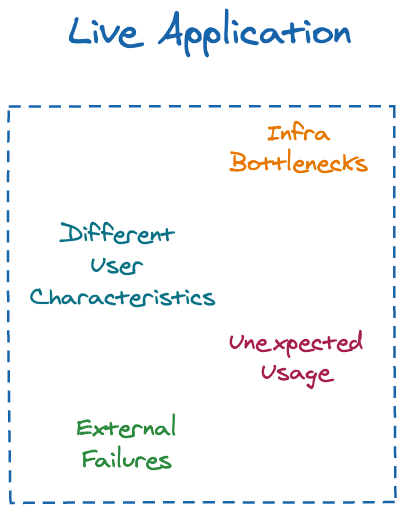
- Users with different characteristics – The sheer amount of technology out there today causes an insurmountable amount of different user configurations that your application might face. In fact, an entire industry – online advertising – is predicated on this very fact for its existence (by profiling users based on the information their setup provides about them).
- External Failures – Most, if not all, modern applications rely heavily on external vendors for various utilities. The core one is of course cloud vendors – if a GCP or Azure service you rely on goes down, so will your application.
- Unexpected usage – Logical and functional testing can only get you so far – there will always be users who misuse (or outright abuse) your software, and you must be able to deal with them appropriately.
- Infrastructure bottlenecks – Your own infrastructure might fail you as well. If a resource inside your topology is pertinent to more than one entity – a database is a good example – latencies caused by actual communication overhead as well as unexpectedly long-running queries might cause timeouts down the road.
These, and more, can all be categorized as things you can either test for in a very limited fashion, or can’t test for at all. Recall, as I mentioned in the beginning of the article, that an obvious (yet easy to forget) fact is that your live application is the most important part of your software development process. These are just too many unknowns to consider when trying to better understand issues with your app.
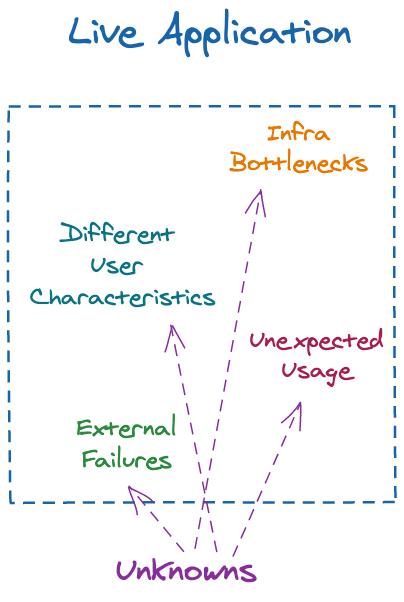
When a production issue stems from one of these concerns, it’s often hard to understand its origin and to identify which thing exactly broke along the way.
It might not seem apparent at first glance, but the problem is exacerbated by the current set of processes we use to understand, debug and resolve production incidents today.
The Current Production Observability Toolbox
Generally speaking, when a production issue occurs we have a few tools we can use to get better visibility into the issue:
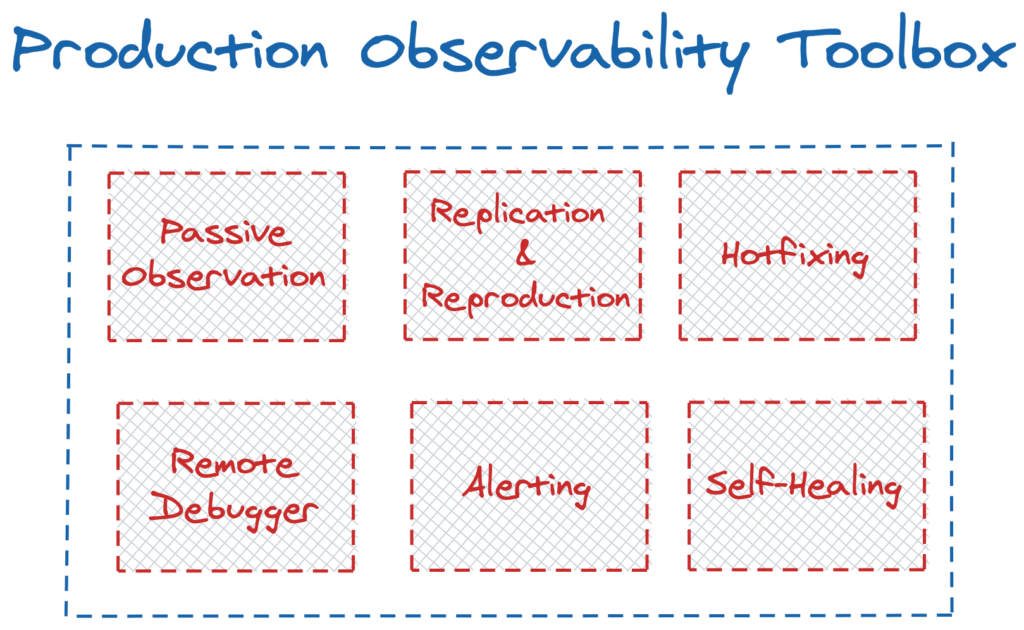
- Passive Observation – A better understanding of the issue is extracted from the existing infrastructure, such as application management (APM) or other tools that either aggregate or enhance your existing application logging and metrics collection.
- Replication & Reproduction – The service is replicated locally or on a similar piece of infrastructure; the bug is reproduced on the replicated service.
Hotfixing for more information – A “patch” with additional logging is created and deployed to the running service, which now emits more granular information. - Remote Debugging – A special type of agent is attached to the running service ad-hoc, imitating a local debugger, and allows for breakpoint-by-breakpoint analysis of the service (including stopping it at each breakpoint).
- Alerting – A set of pre-configured cases – usually based on a specific event occurring or a certain metric reaching a certain threshold – triggers alerts to ensure all stakeholders are aware that something is wrong.
- Self-Healing – When a piece of software fails, a certain actor is in charge of triggering a process (usually a reboot or an instance swap) to account for the failure automatically.
While each of these approaches has its own advantages and disadvantages, they all have one thing in common – none is an extension of the existing pipeline.
Looking at the production environment with the same lens that you used for the stages leading up to it, and especially considering its importance in comparison to those other stages, it’s clear that we should have tools that allow us to streamline as many of the processes related to incident resolution as possible. Self-healing can steer us a bit in that direction, but it’s incredibly difficult to account for all failure scenarios when creating our software, and thus it is as difficult to create self-healing mechanisms that deal with all of those scenarios.
We’ve been extremely good at cleaning up and automating processes before the release, but, until recent years, there hasn’t been as much attention focused on the process of troubleshooting the application once it’s live in production. Debugging and incident resolution have always been defined by a diverse set of processes and tooling (a large portion of which is mentioned above), but there has never been a concrete umbrella term for the people in charge of facilitating and automating these flows, nor the discipline that they follow.

When Google’s Site Reliability Engineering book hit the web, and the SRE profession was introduced, a better definition for both became widespread. There is now a profession inside software organisations whose sole goal is to ensure that engineering practices are applied to the right-hand, production side of the cycle as well.
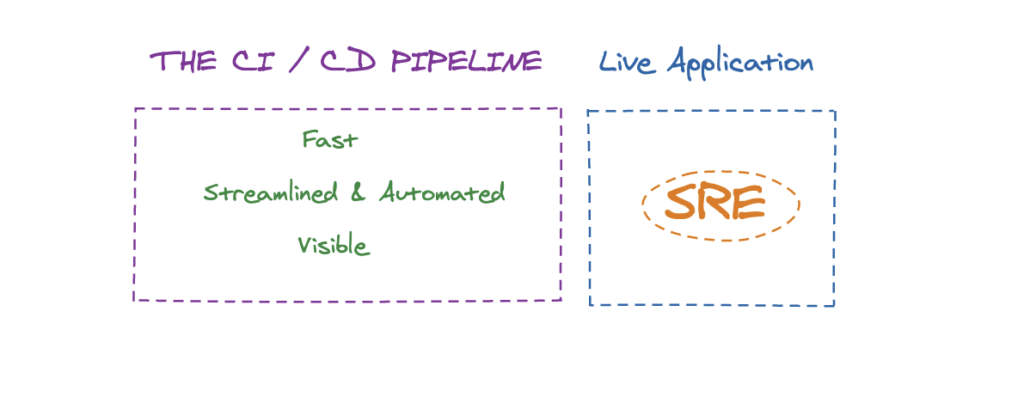
But we would be remiss to so easily define it as an entirely new endeavor. Instead, it’s better to look at it as a continuation of the hard work that came before it – and refer to it as an extension of the existing pipeline:
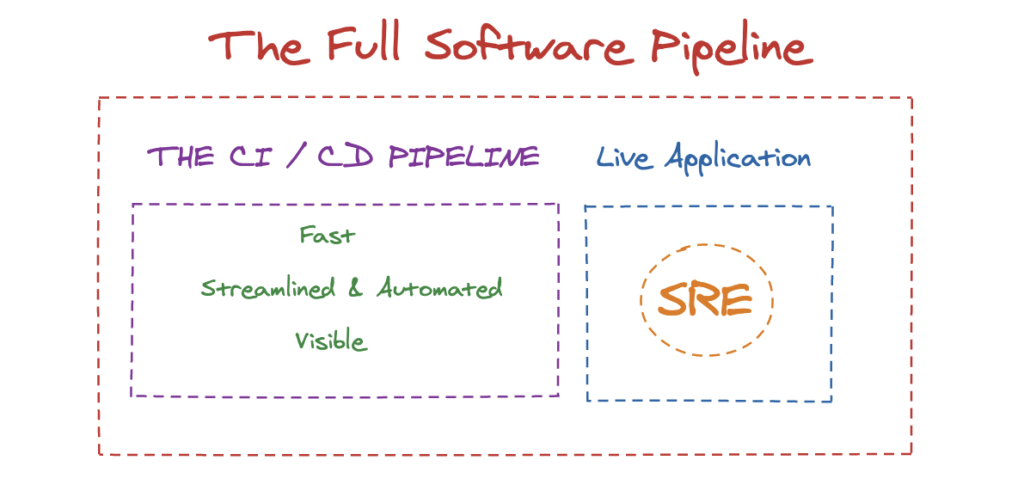
And with this fresh perspective on the process, we can now talk about how to infuse the same agility we experienced in the earlier stages of the pipeline into the art of production troubleshooting as well.
Continuous Debugging & Continuous Observability
The concept of applying the same principles as the pipeline into the production world can be referred to as Continuous Observability.
If observability can be defined as the ability to understand how your systems are working on the inside just by asking questions from the outside, then Continuous Observability can be defined as a streamlined process for asking new questions and getting immediate responses.
But being conscious of our production systems shouldn’t stop there – we also must be able to answer these new questions without causing any damage to the business. That means that outages must be minimized, no customer data should be corrupted and any disruption to the user experience of our products must be mitigated.
To complement the practice of continuous observability, agile teams can also implement Continuous Debugging processes – ways to actively break down tough bugs by getting more and more visibility into the running service, without stopping it or degrading the customer’s experience.
Lightrun was built from the ground up to empower these exact processes.
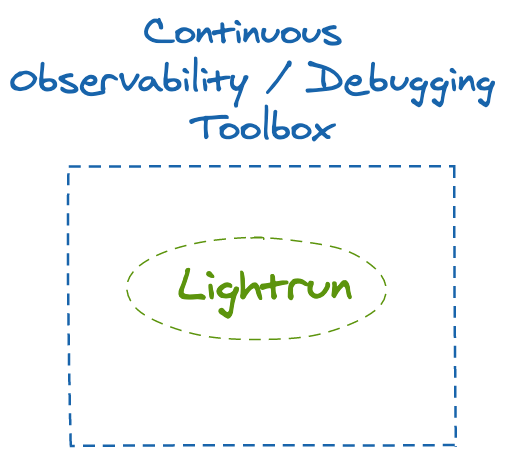
Lightrun works inside your IDE, allowing you to add logs, metrics, traces and more to your running application without ever breaking the process. Instead of having to edit the source code to add more visibility, compile, test, create artifacts, deploy and then inspect the information on the other end, Lightrun skips the process and allows you to add more visibility to production services in real-time, and get the answers you need immediately.
To contrast the Lightrun approach with the current production observability toolbox, let’s look at a couple of examples:
With hotfixing, you have to go through the entire pipeline just to get an additional log line into production. This is a long process that can take many precious minutes for something that should be as simple for production services as it is locally.

With remote debugging, in order to ask any new questions you have to stop the process causing an outage. This is an expensive price to pay for getting a peek at what’s going on inside your service. Since this addition of information happens repeatedly during debugging, this could mean a hefty dent in the overall uptime of your service.

With Lightrun, you can add as much information as you want ad-hoc, without stopping the process, and get all the information immediately in your IDE.

By enabling a real-time, on-demand debugging process and enriching the information the application reveals about itself without stopping the process, Lightrun offers a streamlined experience for what is currently an objectively difficult and manual process. By doing so, it facilitates a speedy incident resolution process, resulting in lower mean-time-to-resolution (MTTR) and a better overall developer experience when handling incidents.

