Debugging Authentication and Authorization with Lightrun
Nov 10, 2021
I won’t sugarcoat it. Authentication and authorization are some of the most painful tasks in backend programming. I’m sorry and I feel your pain. I can’t promise that Lightrun will solve it and make it easy, but it can provide insight into what’s going on under the hood which can save you hours/days/weeks of debugging in the wrong place.
So let’s keep this brief…
For the purposes of this tutorial I’ll use the authentication demo from Spring. The code itself is under the complete directory.
Step 1 – Build the Demo
Open the complete directory from the repository in IntelliJ. I selected to use the Maven project since I prefer it.
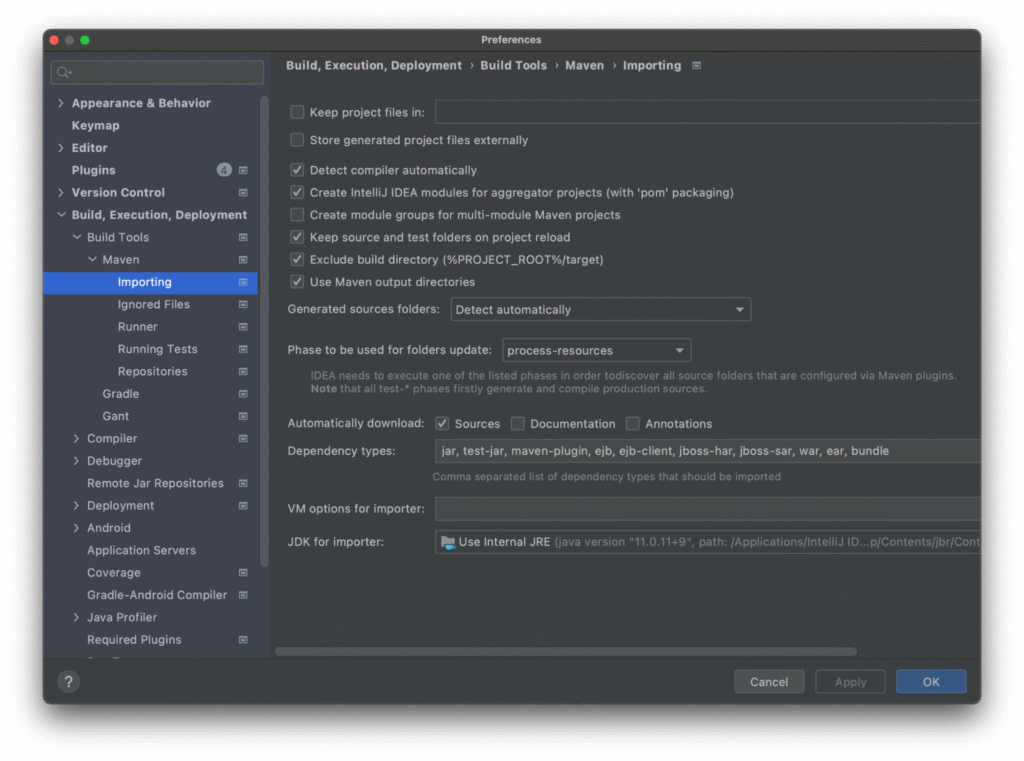
Because we want to do “deep” debugging into the Spring source code, we need an extra step of downloading the Maven source code. In IntelliJ preferences, select Build, Execution, Deployment -> Build Tools -> Maven -> Importing and check the Automatically download sources option:
Press OK.
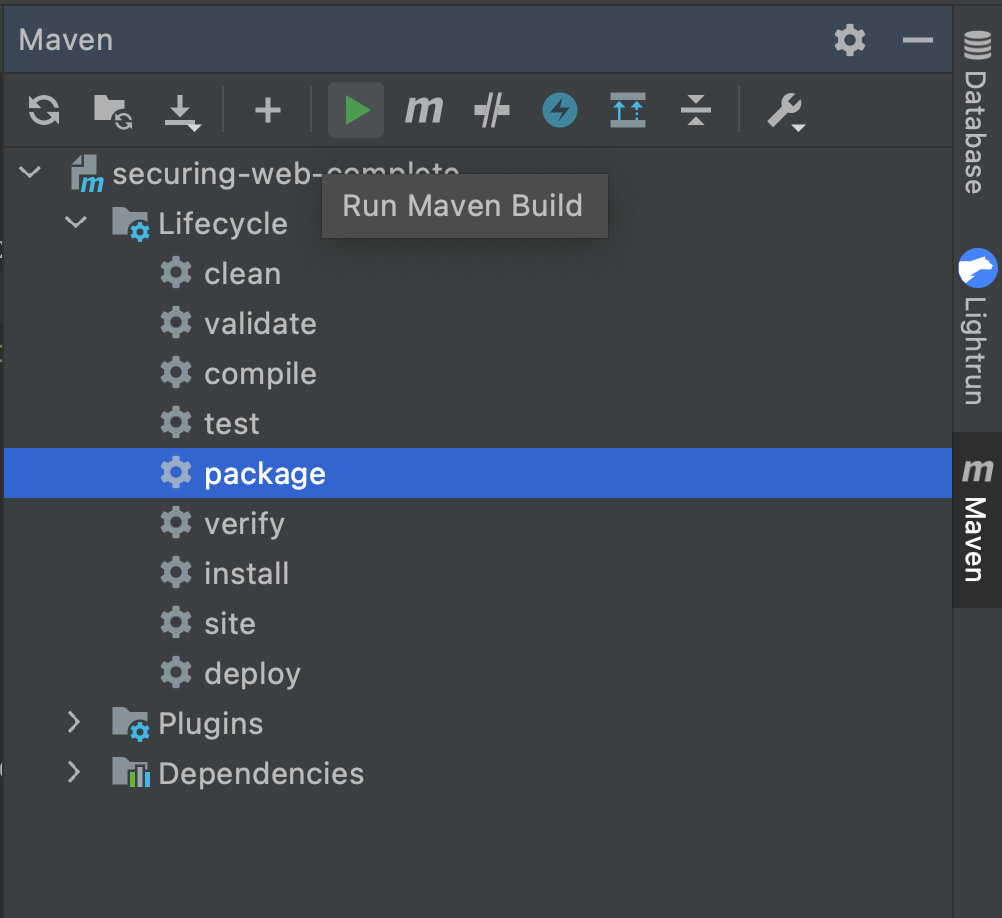
Once this is done, select the Package option in the Maven tool window.
Step 2 – Install Lightrun
If you didn’t do this yet, create a Lightrun account. Download the IDE plugin and set up the agent on your server. I won’t replicate the steps here as they are pretty clear on the website.
You can download the agent into the “Complete” directory then run the app using:
java -agentpath:PATH_TO_AGENT_DIRECTORY/lightrun_agent.so -jar target/securing-web-complete-0.0.1-SNAPSHOT.jarNotice you need to replace PATH_TO_AGENT_DIRECTORY with the right path. Try to avoid shortcuts like ~ which might cause issues.
You can now install the plugin and log in via the IDE.
Step 3 – Set a Snapshot on Authentication
Now we need to open the authentication code in IntelliJ. Select Navigate -> Class from the menu (Command+O or Control+O). Then type in AbstractUserDetailsAuthenticationProvider or its CamelHumps shortcut, audap.
Important: If the file that opens is a decompiled .class file, click the Download Sources banner at the top of the editor. The file must be a Java source file.
Go to the authenticate() method and right-click on the first line. Select Lightrun -> Snapshot:
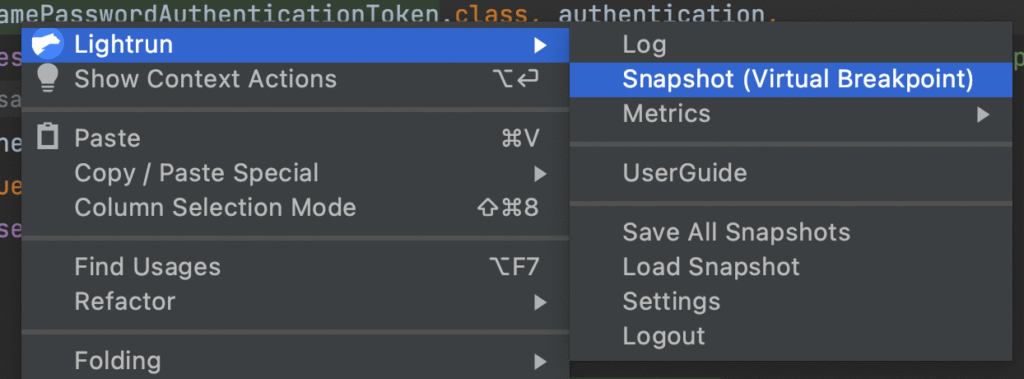
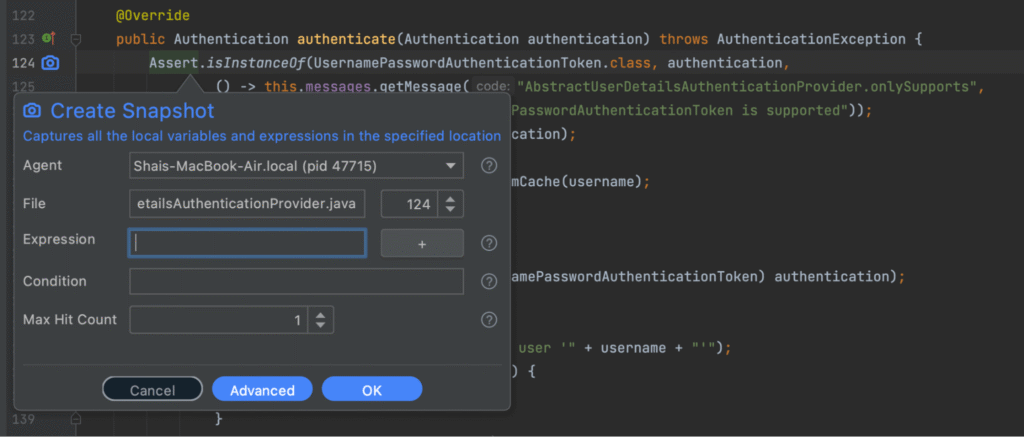
A snapshot is a breakpoint that doesn’t “break”. It gives you the stack trace, variables, etc. It can be applied conditionally like any other breakpoint. But it won’t block the execution and won’t break the server.
We will see a dialog like this that lets us tune snapshot parameters:
We now have a snapshot which we can see in the camera icon on the left and within the right hand side.
Step 4 – Fail on Logging In
Failure is easy. Go to https://localhost:8080/ and try to log in by pressing the button in that page. Notice that this will also work if you’re running or debugging remotely.
Once you fail to log in, go back to the IDE. You should see a snapshot like this:
This is a stack trace like any other stack trace you have in the debugger. You can inspect variable values. Go up the stack and look at the values of variables there etc.
Notice I can see the principal and credentials values which helps me see what I did when trying to log in.
Important: Those of you who are security conscious might be justifiably concerned about the security implications involved. So once you get this working, the manager of your Lightrun account can add these classes to the Lightrun blocklist and block the ability to place snapshots in these files!
Apply This to Your Own Application
You will probably need to place a breakpoint in a different class in your authorization chain. Use the class explorer tool to find the appropriate entry point. Trial and error is pretty easy in this case.
Binding the agent and the rest of the instructions should apply almost exactly the same to most cases.
See Also
See more posts in this series:

