How Lightrun’s Dynamic Traces Help Debug Complex Application Flows
Mar 12, 2025 / Updated: Apr 05, 2026


A Comprehensive Guide for Debugging Complex Application Flows
Background
Debugging software, whether during development or incident investigation, often begins with a manual and error-prone process. Developers typically scatter logs and snapshots across the codebase, allowing them to trigger multiple times. They then inspect the outputs and sift through the results to identify those relevant to the issue under investigation.
Developers tend to group results that stem from the same user request or transaction. This grouping is crucial as it allows tracking the progression of data and control within a single flow, providing valuable insights.
Consider the example of debugging a user creation process:
- A snapshot is placed where the request is received from the UI.
- A second snapshot is placed where all validations are performed.
- A third snapshot is added where the new user is inserted into the database.
Obviously, comparing a hit of the first snapshot that triggered when adding john.smith@google.com to a hit of the second snapshot that triggered when adding jane.doe@microsoft.com will offer little value.
However, comparing hits of all three snapshots that were all triggered when john.smith@google.com is likely to provide a clear view of how data flows through the user creation process.
This highlights the need for a debugging mechanism that ensures snapshots and logs are tied to the same execution context, enabling developers to trace data flow accurately and efficiently. The OpenTelemetry (OTEL) framework attempts to address this by allowing static tracing instructions embedded in the code. However, like many traditional observability tools, this approach has significant drawbacks:
- Upfront decisions: Developers must predefine where to place trace spans, before knowing which areas will be relevant for debugging.
- Time-consuming iterations: If additional trace spans are needed, they must be added to the code, built, tested, and deployed. Thus delaying investigations.
- Wasteful overhead: Trace spans included “just in case” incur ongoing costs for log processing and storage, despite being rarely needed.
- Generic data: The telemetry data is not customized for investigating specific issues, limiting its usefulness.
Lightrun’s Dynamic Traces lets you follow requests and transactions in your code at runtime while eliminating inefficiencies:
- Ad-hoc – Define traces as needed, no upfront instrumentation required.
- Granular data – Capture precise values and custom expressions.
- Time efficiency – Skip the build-test-deploy cycle.
- Cost efficiency – Avoid unnecessary logs that pile up without adding value.
With Lightrun’s Dynamic Traces, tracing is finally as dynamic as the issues you’re debugging.
This guide explores the modern live debugging process, highlighting Lightrun’s core runtime debugging capabilities—Logs, Metrics, and Snapshots—while introducing the innovative Dynamic Traces feature.
Lightrun Live Debugging Overview
In contrast to traditional debugging, which relies on APM and logging tools, Live Debugging empowers shift-left observability for developers. It enables developers to debug applications at runtime directly from their native IDEs, without needing to ingest new logs that involve new build and test and deploying of the apps. This approach significantly reduces the mean time to resolve (MTTR) for critical issues. Lightrun is leading the market with its developer observability platform, which provides developers with a comprehensive solution to add actions like Dynamic Logs, Snapshots, and Metrics at runtime (Fig 1) directly from the IDE plugins included in the platform.
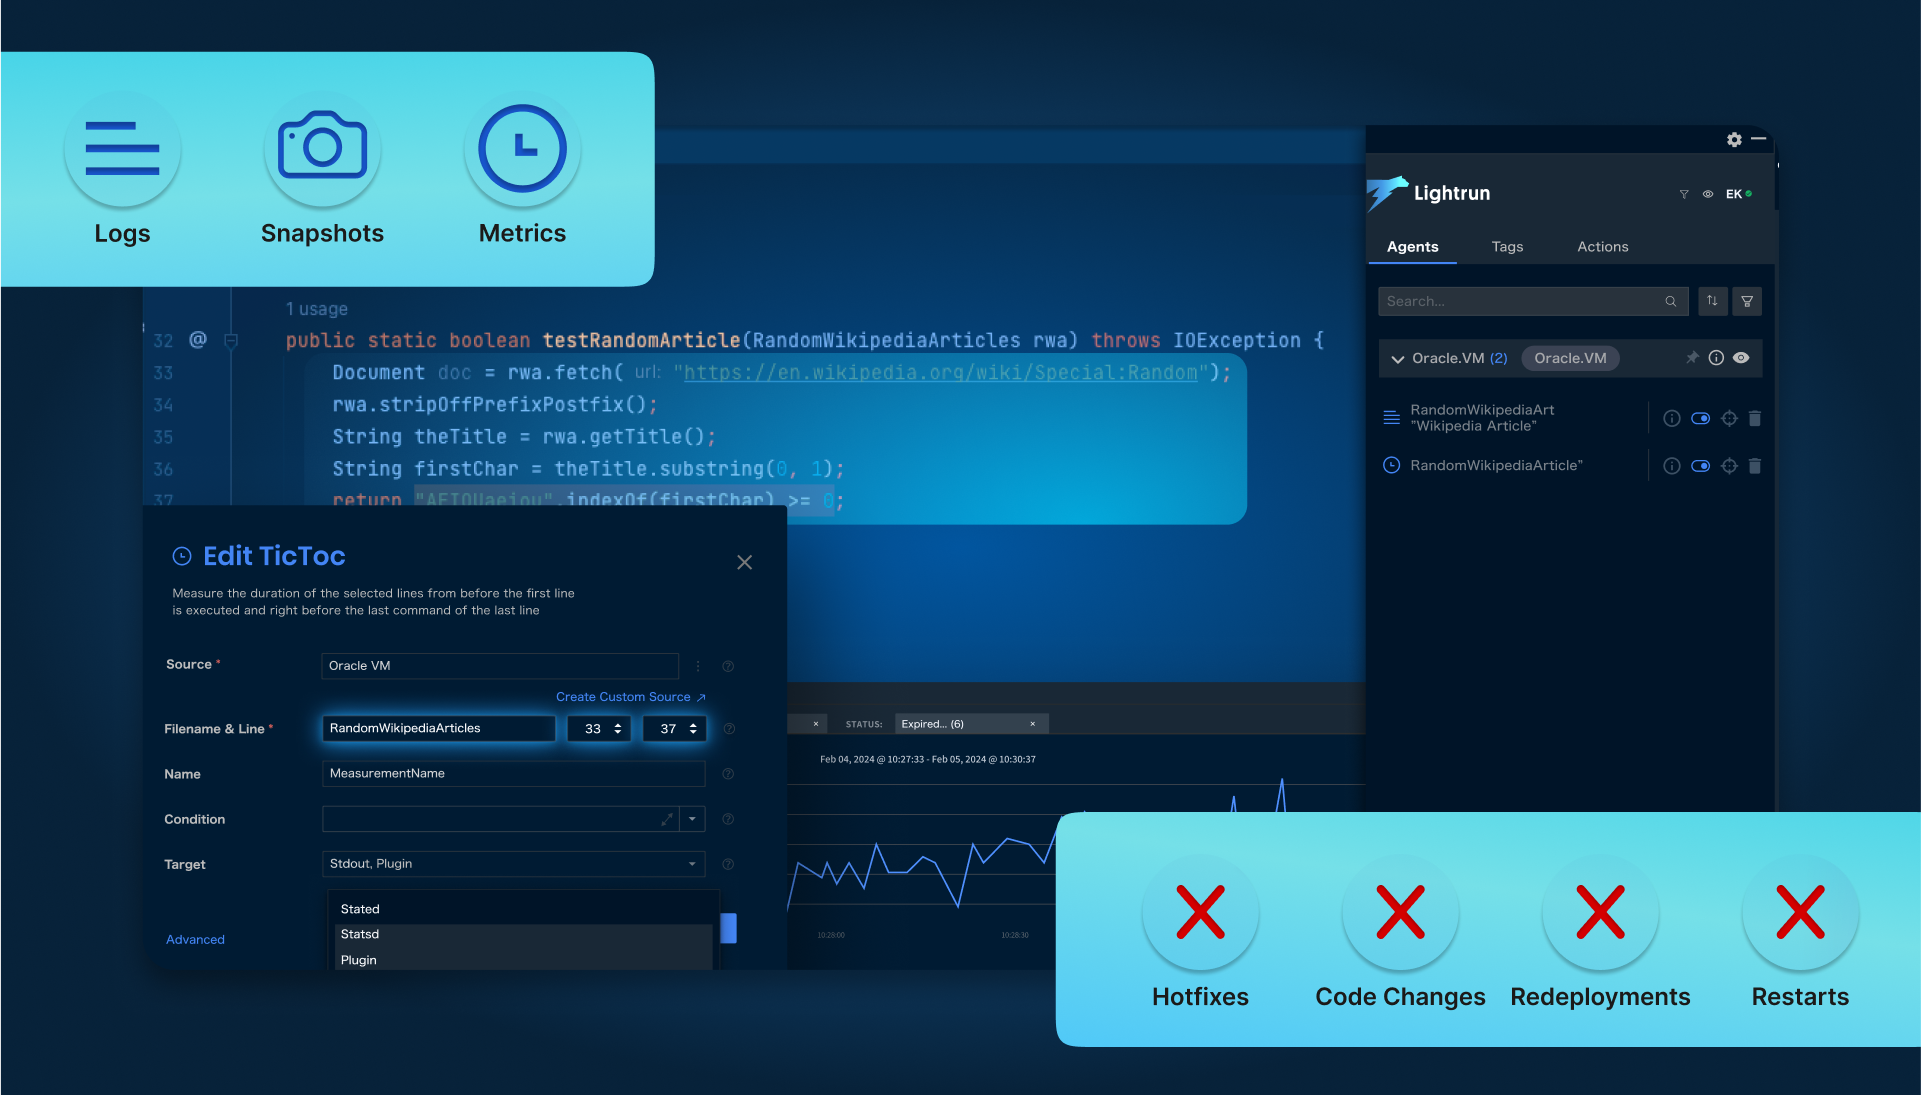
Fig 1: Lightrun’s Supported Troubleshooting Actions
Introducing Dynamic Traces
Now that we’ve gained a bit more context about Lightrun, let’s understand what Dynamic Traces brings on top of it. Lightrun Dynamic Traces empowers developers to troubleshoot complex application flows by capturing context-specific snapshots at multiple points throughout the flow. With Dynamic Traces, Lightrun takes the existing powerful capability of dynamically deployed snapshots and allows one more significant capability – ensuring the triggered snapshots are all coming from the same request or transaction – thus guaranteeing that results are all related.
A trace allows developers to specify a set of snapshots that should be grouped based on their execution thread (aka as a Trace). Developers also specify the point at which the traced flow starts (aka as a trace Entry Point). For each time the entry point is reached, a new Trace Result will be generated, collecting hits of subsequent snapshots that were reached within the same execution thread.
Below is a simplified example of a typical e-tailing application, which we’ll use to demonstrate how Dynamic Traces can be applied to debug complex workflows.
Let’s imagine there’s a bug affecting the order placement process, reported by the user barakb. We suspect the issue may be linked to the fact that barakb edited his payment method before submitting the order.
By setting an entry point snapshot at the login stage, we can apply a condition that tracks only barakb‘s requests. From this point onward, the trace will follow the same execution context, ensuring that subsequent snapshots are only triggered if they are part of barakb‘s request.
Additionally, placing a snapshot in the code branch that handles payment method edits will help pinpoint whether this specific action contributed to the bug’s occurrence, allowing for targeted troubleshooting with ease.
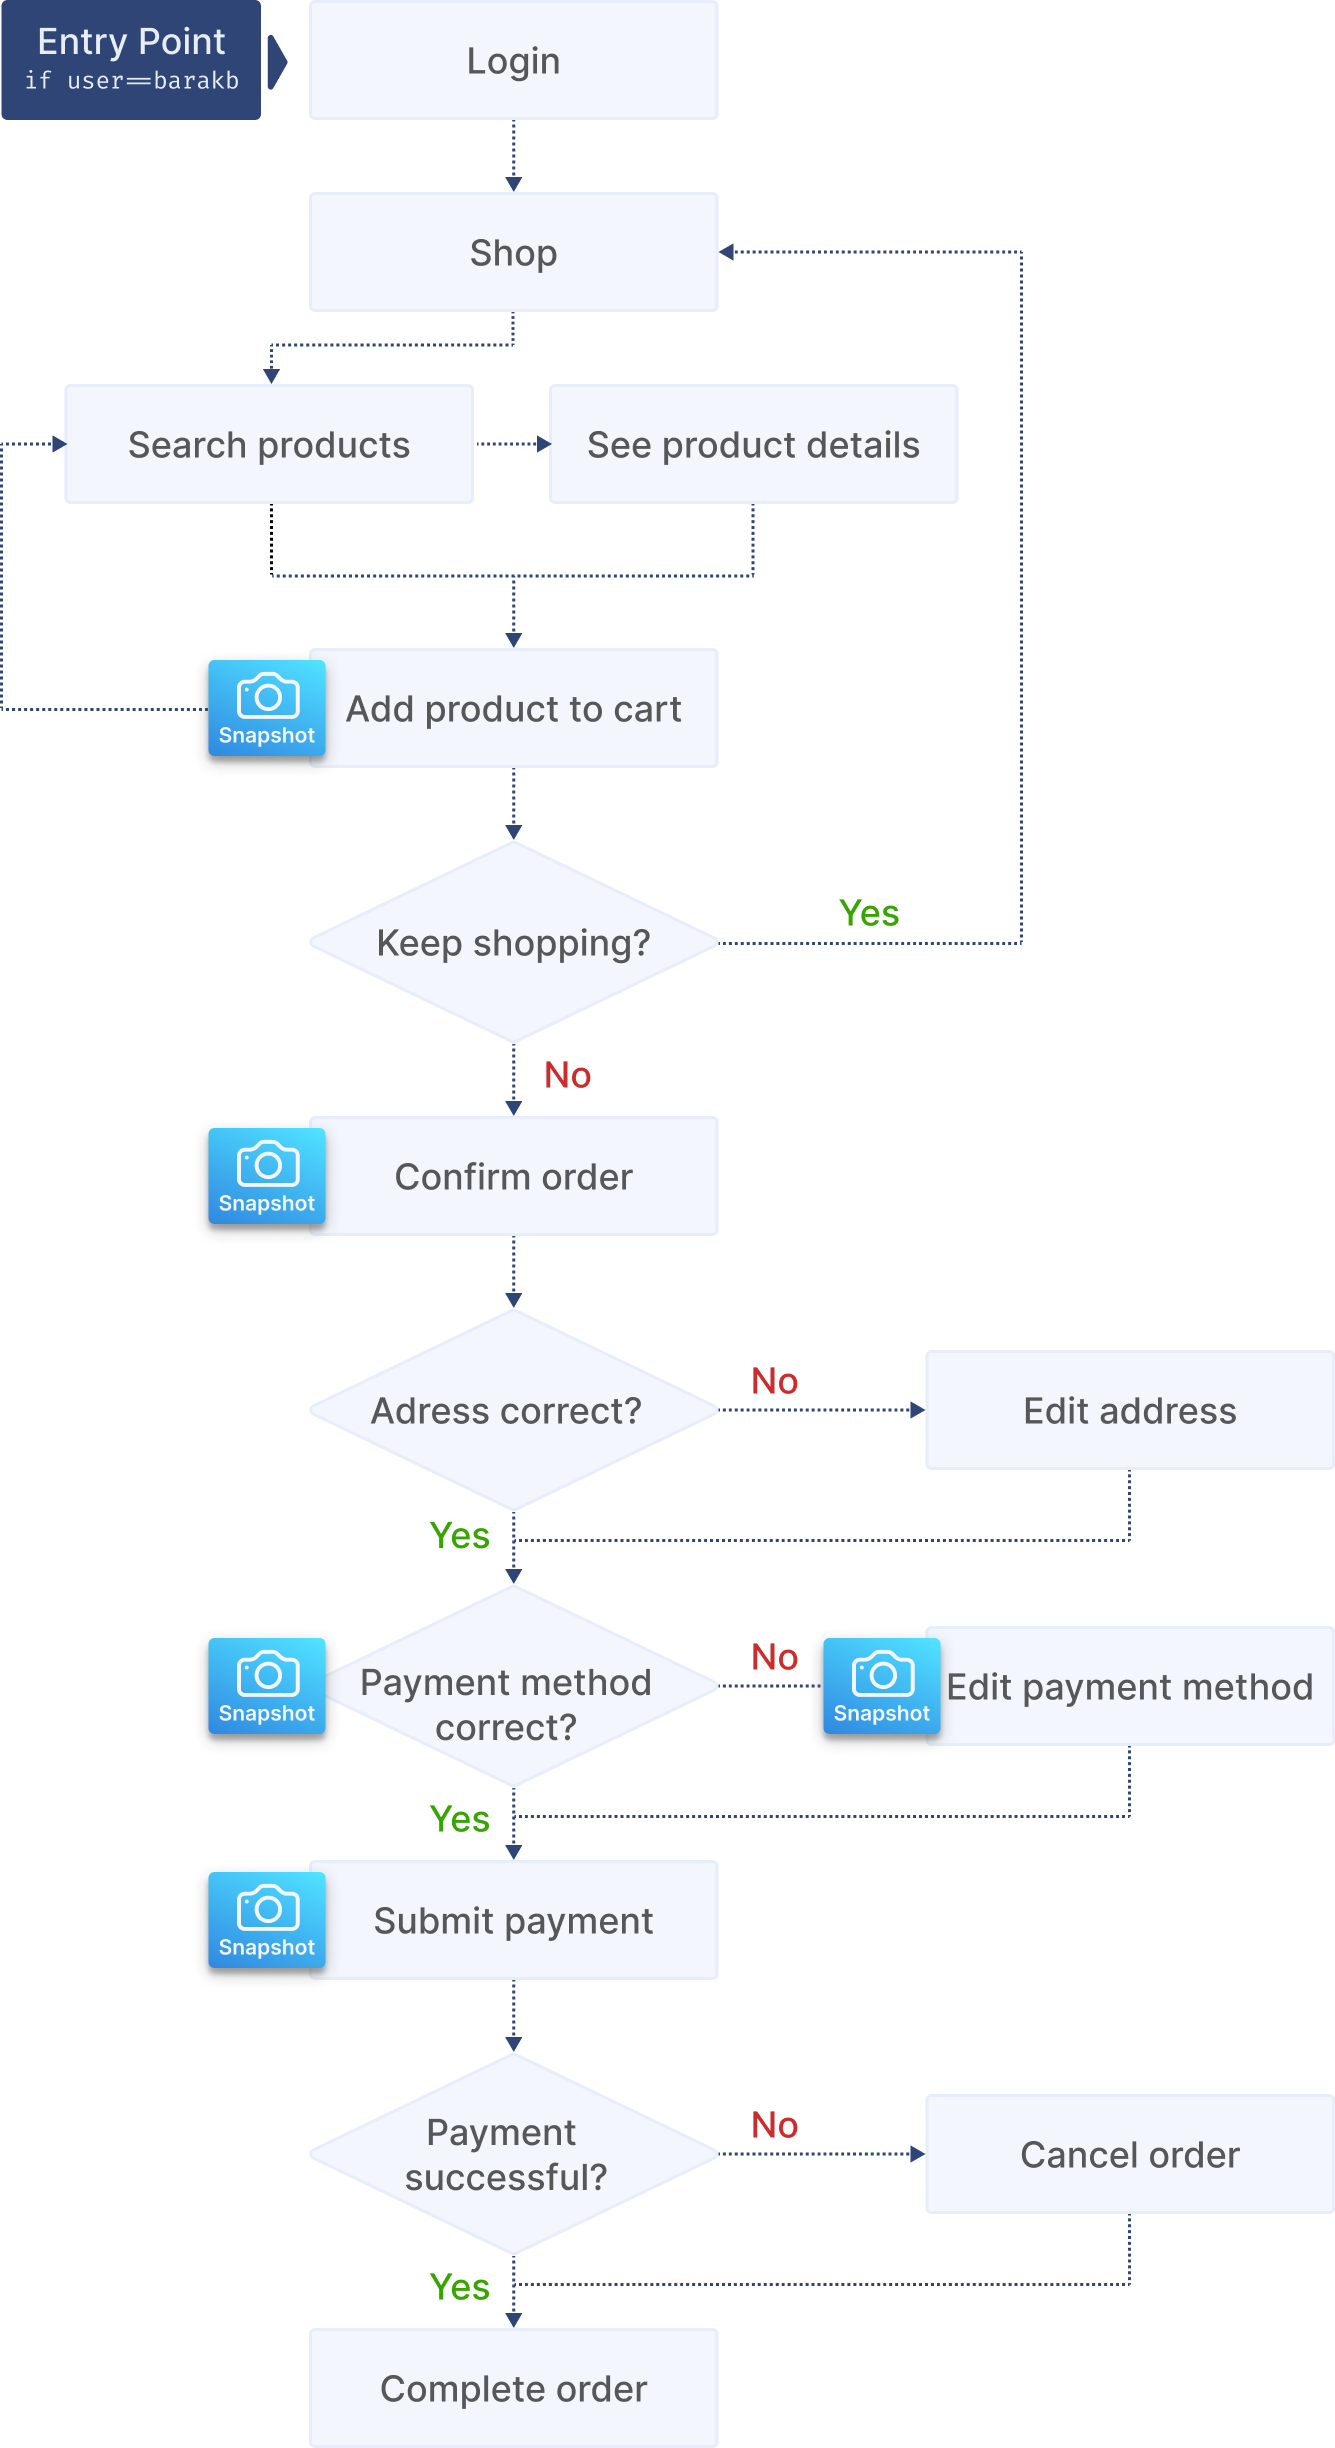
Fig 2: Lightrun’s Dynamic Traces Flow Illustration
Top 4 Use Cases for Employing Dynamic Traces
- Investigating issues in complex flows
Requests and transactions often flow through multiple methods and classes. When an issue is reported within such a flow, developers typically place Snapshots at key points to understand how requests and data propagate.
However, different Snapshot hits may originate from separate executions of the same flow. As a result, developers must manually sift through the hits to ensure they are comparing data from the same execution.
With Lightrun’s new Dynamic Traces, this correlation happens automatically. Developers simply:
- Create a new Trace.
- Add Trace Snapshots at key points along the flow.
- Mark the Snapshot at the start of the flow as the Entry Point.
- Activate the Trace.
Once activated, every time the flow executes and the Entry Point is reached, a new Trace Result is generated. This Trace Result groups hits from the Entry Point and any other Trace Snapshots that trigger within the same execution context.
The results are then presented clearly, showing all hits in order of execution, making it easy for developers to analyze the flow without manual filtering.
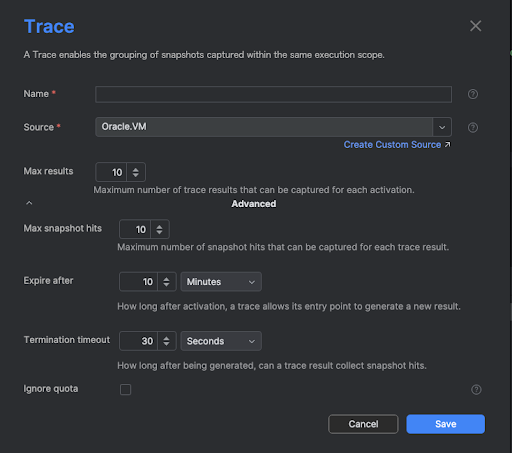
Fig 3: Creation of a new Lightrun dynamic trace
-
Analyzing issues in flows under specific conditions
Many code issues only occur under specific conditions—for example, only when handling certain user inputs, processing edge cases, or under high system load. In such cases, it’s crucial to:
- Set conditions at the start of execution (e.g., only trace requests from a specific user, request type, or error scenario).
- Automatically correlate subsequent Snapshot hits to track execution only when those conditions are met.
In such use cases, Dynamic Traces allow developers to define conditions upfront so only relevant executions are traced, reducing noise and making debugging more efficient.
Issues in requests and transactions often occur only under specific conditions. For example:
- A login issue may happen only when a particular user attempts to log in.
- A checkout failure may occur only when a shopping cart contains more than 20 items.
In such cases, not only does the developer have to scatter Snapshots across the relevant flow, not only do they need to manually correlate results to ensure only data from the same execution context is compared, but they also have to ensure that all these results stem from an execution where the relevant preconditions were met. Moreover, setting the condition in any of the Snapshots along the flow is, in many cases, impossible, as the required data may not be available at certain points. For example:
- The user’s ID may only be explicitly available at the beginning of the flow, after which it is embedded into an SQL request and no longer directly accessible.
- The number of items in the cart may only be available in the Cart class but not in the validation and billing classes used throughout the checkout flow.
Once again, Lightrun’s new Dynamic Traces makes investigating such issues simple and straightforward. Developers just need to:
- Create a new Trace.
- Add Trace Snapshots at key points along the flow.
- Mark the Snapshot at the start of the flow as the Entry Point.
- Define a condition for the Entry Point, ensuring the Trace activates only when the condition is met. For example:
user.getId().equals(“john.smith@google.com”)cart.numOfItems() > 20
Activate the Trace.
Now, whenever the flow executes, the Entry Point is reached, and the condition is satisfied, a new Trace Result is generated. This Trace Result automatically groups hits from the Entry Point and any other Trace Snapshots that trigger within the same execution context.
Since tracing only starts when the condition is met, all subsequent hits within the Trace are guaranteed to come from relevant executions, eliminating the need for manual filtering.
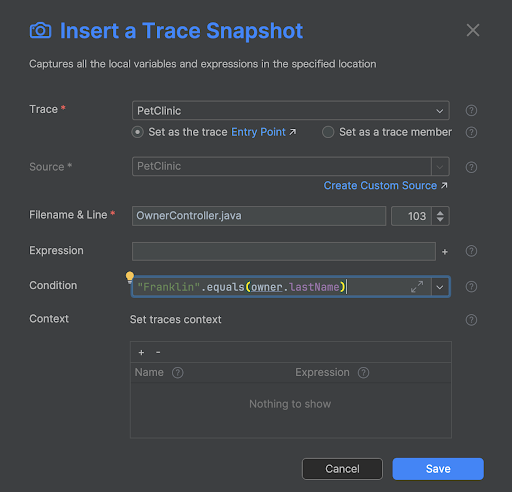
Fig 4: Creation of the entry point snapshot within a dynamic trace
-
Diagnosing issues in branching flows
Application flows often branch based on various conditions. For instance, a request to update a user’s details may split into multiple subflows, each handling tasks specific to different user types, before converging back to complete the update process.
When an issue is reported in such a flow, it’s often crucial to quickly establish which branches were taken during the execution that led to the reported issue.
With Lightrun’s Dynamic Traces, developers can quickly and easily pinpoint the code branches responsible for a bug by:
- Create a new Trace.
- Add a Trace Snapshot at the start of the flow and mark it as the Entry Point.
- Add Trace Snapshots at key branch points in the flow.
- Add a Trace Snapshot at the location where the issue manifests.
- Activate the Trace.
Now, whenever the flow executes and the issue reproduces, the developer can inspect the Trace Result to determine which branch snapshots were triggered, helping them identify the branches instrumental in reproducing the issue.
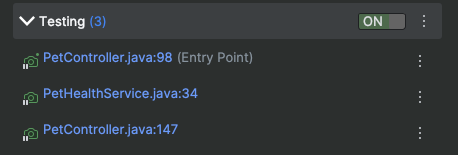
Fig 5: Lightrun dynamic trace activation
-
Inspecting issues in shared code
In large codebases, it’s common to share commonly used procedures across multiple flows and processes. For example, a single class might handle all database access, with various flows and processes calling its methods whenever data needs to be stored or retrieved.
When an issue arises in such a shared code area, and it’s known that the issue only occurs when called from a specific flow, placing a regular Snapshot may be wasteful, since most calls to the shared code come from other, irrelevant flows.
With Lightrun’s Dynamic Traces, developers can now easily isolate only the relevant Snapshot hits in shared code by:
- Create a new Trace.
- Add a Trace Snapshot at the flow that triggers the issue, marking it as the Entry Point.
- Add Trace Snapshots at key points within the shared code.
- Activate the Trace.
Now, developers can be certain that every Trace Result originates from the specific flow that causes the issue, ensuring that all captured information is relevant to debugging the shared code area.
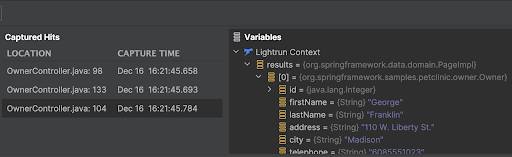
Fig 6: Example of a Lightrun dynamic trace results with context
Dynamic Traces let you trace shared code only when it’s accessed through a relevant flow, eliminating noise and making debugging much faster!
Core Benefits of Dynamic Traces
By adopting Lightrun’s Dynamic Traces, engineering teams can realize significant benefits. As emphasized in the use cases above, and through the enhanced debugging workflow enabled by Dynamic Traces, organizations can improve the following aspects:
- Debugging Complex Flow-related bugs: Dynamic Tracing allows debugging issues and incidents that are much harder to debug with isolated snapshots. With Dynamic Tracing, debugging the aforementioned use-cases becomes a much simpler and time-efficient task
- Reduce observability costs: Due to reduced costs of tracing
Bottom Line
As applications become more complex, swiftly identifying issues across execution flows is critical for maintaining developer productivity and operational efficiency. By shifting observability left with live debugging—leveraging Dynamic Traces—teams can proactively tackle debugging challenges. This paper highlights how Dynamic Traces streamline troubleshooting for intricate use cases such as investigating issues in complex code flows, issues that only happen under specific conditions, issues within branching flows, or issues in shared code. As we explained in this paper, Dynamic Traces are a perfect solution for each of these use cases, as they enable developers to pinpoint root causes and resolve issues faster—all within their IDE.
To get started with Dynamic Traces, visit our [website] or learn from our technical documentation