From Monolithic to Microservices: Code Instrumentation Trends
Software architectures are greatly influenced by the size and scale of the software applications. With growing size, the code base becomes complex. With scale, the deployment becomes challenging. The result: debugging becomes an increasingly time-consuming process for developers.
Code instrumentation is a critical practice that helps developers during debugging. Back in the day, when software systems were limited to a bunch of sub-routines executed on mainframe computers, debugging was relatively simple. Those were the early days of monolithic software architecture. Fast forward to today, and most software systems are based on microservices architecture. This trend has a profound impact on how code instrumentation influences developer productivity.
Code Instrumentation: The Traditional Approach and Its Pitfalls
The core premise of code instrumentation is to enable developers to capture the runtime behavior of software applications. This is achieved by means of additional code statements added to the software’s source code. These code statements generate telemetry data, which aids in debugging any anomalies during the execution of the software.
Traditionally, code instrumentation is achieved in one of the following ways:
- Adding log statements. Log statements are added to code to record information about the internal execution context of the program — for example, the value of a variable, or the result of an arithmetic or logical expression.
- Adding profiling information. Profiling information captures performance measurements of software execution — for example, the time elapsed for executing a sequence of code instructions.
- Using brute-force modification of the source code. Additional code can be added directly to the source code to elicit a specific behavior to analyze hard-to-find bugs — for example, adding sleep statements to deliberately delay the execution of a code segment to debug a race condition.
The exact method of code instrumentation is chosen by the developers based on a specific debugging scenario. However, the effectiveness of code instrumentation is also dependent on the software architecture.
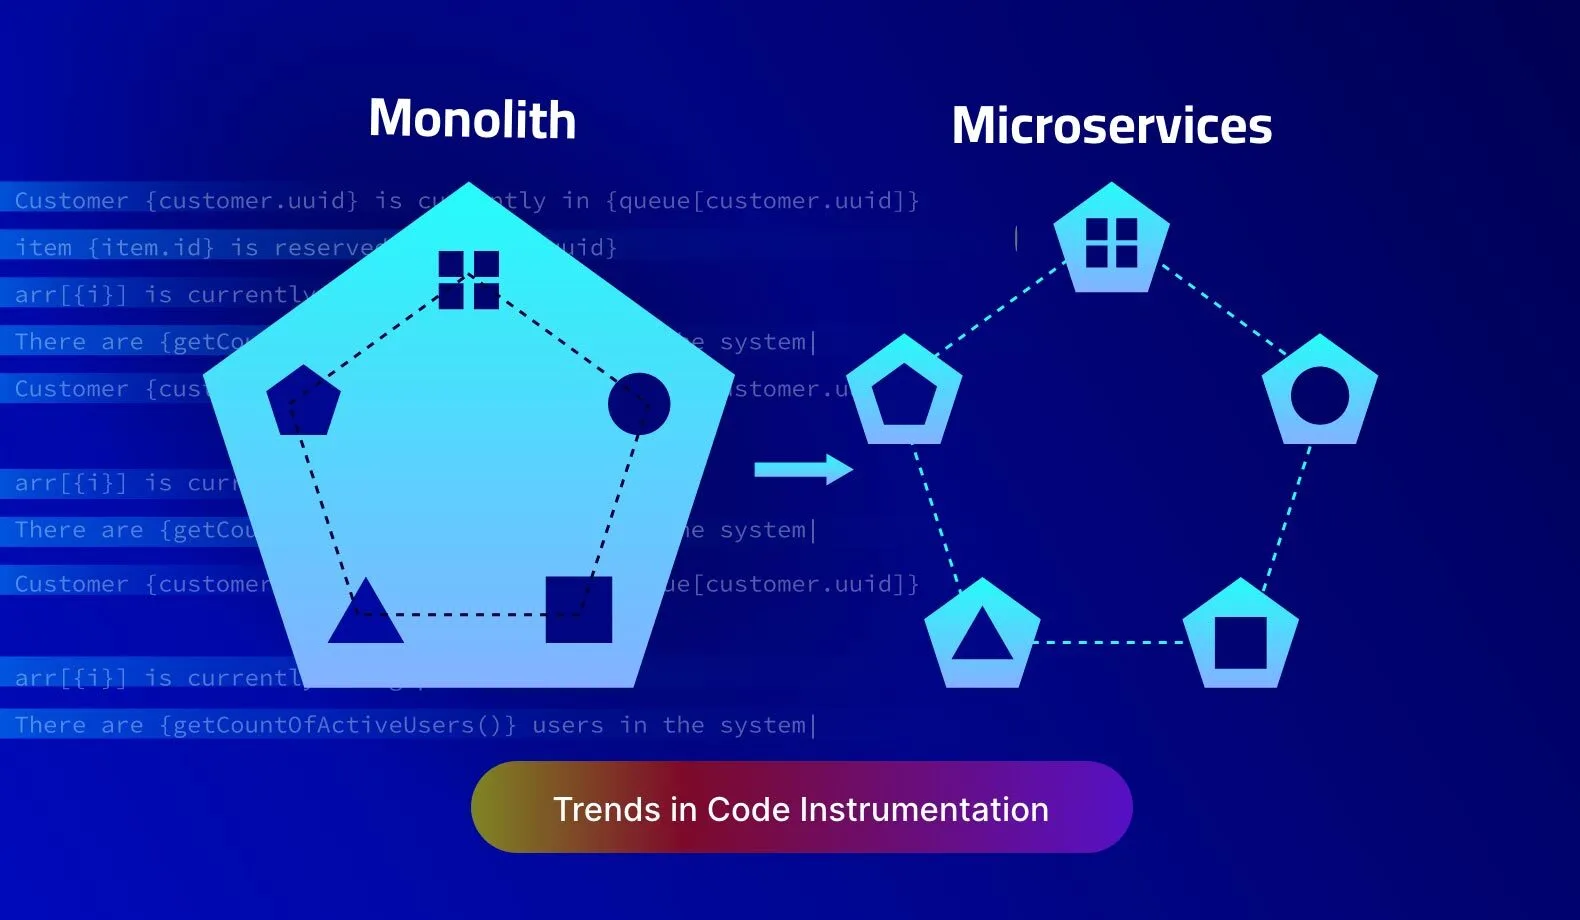
Code Instrumentation in Monoliths and Microservices
In the monolithic architecture, the entire source code for an application is built into a single execution package. Additionally, it is deployed on a single or limited set of computing infrastructure. Microservices architecture is more modular and has a much larger spread of deployment options.
While all the above methods of code instrumentation are valid for any kind of software architecture, their effectiveness in debugging varies greatly depending on the chosen architecture.
Consider these scenarios:
- Analysing runtime execution through log messages. In the monolithic architecture, the log messages result in a sequential trail of telemetry data. Microservices are organized as independently running services which generate multiple logs to be analyzed in parallel.
- Profiling for performance bottlenecks. In the monolithic architecture, code execution time is dependent on the CPU. In the microservices architecture, it is also dependent on external services.
- Debugging race conditions. In a monolithic application, race conditions are impacted by threads and CPU cores. In a microservices application, there are additional factors, such as the load on external services and network delays.
As software moves from monoliths to microservices, there is an apparent mismatch in expectations from code instrumentation and its outcomes. As a result, developer productivity takes a hit.
Code Instrumentation and Developer Productivity
A developer usually spends more time debugging and fixing bugs than writing code. However, due to the added complexities induced by the microservices architecture, using traditional methods of code instrumentation gets challenging.
Ultimately, the microservices developer’s productivity during debugging is mired by the following three factors:
- Collecting code instrumentation data across services. Developers spend additional time assimilating the telemetry data from various services before they can perform the root cause analysis of a bug.
- Sequencing code instrumentation data for backtracking. Most debugging techniques revolve around backtracking code execution from a certain point to identify possible anomalies related to the bug. Backtracking across multiple independently running services in parallel can be mind-boggling for developers.
- Handling data races across the entire deployment. Race conditions due to threads is a localized problem that is relatively easy to identify. However, in the case of a geographically distributed deployment and with requirements for syncing across multiple devices, the scope of a race condition increases manifold.
While the microservices architecture is the way forward for building software that scales well and is resilient to outages, it imposes more burden on developers. As a result, the traditional code instrumentation approaches hamper developer productivity during debugging.
Dynamic Instrumentation vs Static Instrumentation
The traditional code instrumentation practices have grown around the modification of source code with embedded code statements. However, over the last few years, dynamic instrumentation has evolved to allow the instrumentation code to be injected at runtime, without modifying the source code.
Static instrumentation is inflexible to updates in source code and is burdensome to manage with changing requirements during debugging. Dynamic instrumentation allows developers to instrument and inspect code segments at the same time, in a live environment. Thus, it is independent of source code modifications, and allows developers to connect with their live applications anytime.
Here at Lightrun, we believe in letting developers stay connected to their live applications all the time. Therefore, we are committed to furthering this innovation around dynamic instrumentation to help developers gain complete visibility into the internal state of their production applications.
Dynamic instrumentation has several advantages:
- Boosting debugging productivity. With dynamic instrumentation, developers get a vantage point to analyze the source code exactly the way they need to. They are empowered to add logs at runtime and instantly access telemetry data generated from these logs based on a specific debugging scenario. With Lightrun, developers can add dynamic logs anywhere in the code base, without rebuilding, redeploying, or restarting the application.
- Improved MTTR. The larger impact of dynamic instrumentation is on the overall uptime and quality of the software. That’s because dynamic instrumentation allows developers to short-circuit the deployment pipelines to directly work on the production environment without worrying about reproducing bugs in development or staging environments. Lightrun greatly eases the burden on DevOps teams to allow developers to dynamically add new telemetry to the production environment in a safe and configuration-free way.
- Reduction of hidden costs of instrumentation. Code instrumentation generates a lot of data. In the case of static instrumentation, developers tend to log a lot of data to minimize frequent code changes during debugging. This creates a situation of overlogging wherein the data piles up and adds to the cost of storage. Dynamic instrumentation eliminates this cost to a large extent. Lightrun solves the problem of overlogging by allowing just-in-time and just-in-quantity logging which can greatly reduce the logging costs.
Dynamic Instrumentation and Observability
Observability is the ability to query the internal state of software at runtime, without affecting its code, configuration, or environment. When dynamic instrumentation is leveraged to extract telemetry data from a live application, observability is automatically achieved.
At Lightrun, we have architected our platform to be truly focussed on developer observability that supports dynamic instrumentation. This enables:
- On-demand debugging to assist developers in adding logs, snapshots (virtual breakpoints) and code-level metrics dynamically to a running application, and a single window for displaying them.
- Developer workflow integration such that developers can work from the comfort of their IDE to facilitate dynamic instrumentation.
- Architecture agnostic observability that works under any architectural or deployment pattern, and across multiple cloud platforms, without needing DevOps intervention.
Lightrun currently supports Java, Kotlin, Node.js, Python, and .NET/C#. IDE plugins are available for IntelliJ IDEA, VS Code, PyCharm, and WebStorm. To take the Lightrun platform for a spin, sign up for a free trial!

It’s Really not that Complicated.
You can actually understand what’s going on inside your live applications.