Putting Developers First: The Core Pillars of Dynamic Observability
Sep 24, 2023


Introduction
Organizations today must embrace a modern observability approach to develop user-centric and reliable software. This isn’t just about tools; it’s about processes, mentality, and having developers actively involved throughout the software development lifecycle up to production release.
In recent years, the concept of observability has gained prominence in the world of software development and operations. Rooted in three foundational pillars—logging, metrics, and tracing—observability provides a comprehensive understanding of application behavior. These pillars allow teams to diagnose and address issues with greater precision and efficiency.
However, a notable challenge in observability is that many tools available today are designed by and for operations teams. Their primary focus often lies in monitoring, alerting, and system health from an infrastructural standpoint. This design bias can leave developers, who require a different granularity and data context, somewhat in the lurch. Instead of offering insights into code behavior, performance bottlenecks, or specific code-level issues, traditional observability tools may present data in a way that’s more aligned with operational needs. This mismatch underscores the importance of creating or adopting observability tools that cater explicitly to developers, ensuring that they can gain actionable insights from the system and application data in a manner that resonates with their specific workflow and challenges.
With the surge in adopting a platform engineering approach, there’s a profound shift in how organizations perceive and manage the Software Development Life Cycle. At the heart of this approach is providing developers with a robust platform that abstracts away infrastructural complexities and offers tools and services that accelerate development. As platform engineering becomes a catalyst for advanced SDLC management, there is a pressing need to elevate observability proficiency across organizations. Platform engineering, by design, involves a profound intersection of development and operations, which necessitates that the engineers possess a unique blend of skills. Among the emerging skill sets, debugging and observability stand out as paramount.
Why Developer Ownership is Non-negotiable
Over recent years, the software engineering industry has recognized the importance of granting developers ownership of their products to ensure software reliability, agility, and ease of maintenance. Developers should have control over their code, from creation to deployment. They must be able to deploy, rollback, observe, and debug code in production in order to speed up the feedback loop at the core, enabling faster improvements.
The software and overall user experience could improve with the right tools and responsibilities. Real-time debugging in a production environment is invaluable as developers have more context and knowledge to quickly fix the issue as they understand the recent changes best.
The Lightrun Three Pillars of Dynamic Observability
Lightrun offers a suite of features designed to enhance developers’ capabilities. One standout aspect is Lightrun’s ability to debug applications right in the live environment, providing real-time, on-demand insights irrespective of where the application is running.
Pillar 1. Dynamic Logging
Text logging remains a fundamental debugging tool. However, using it in remote environments presents challenges. Centralized logging platforms have grown, offering centralized log ingestion with efficient search capabilities. Yet, they often fall short for real-time remote debugging, mainly because of inherent delays, focus on post-event analysis, and disconnection from the local development environment.
In debugging remote environments, traditional logging can slow down the feedback loop for the developer, as adding a log line usually requires at least an entire CI/CD pipeline run, and most often, deploying a new version to production is impossible or hard to do frequently.`
Many developers opt for overlogging to compensate, leading to increased storage, computation, and possible licensing costs, not counting the difficulty of navigating a massive amount of logs to find the required piece of information.
Finally, log tools are often poorly integrated into developers’ IDEs, resulting in an unnecessary learning curve and shifting developers’ attention away from their primary environment. In some extreme cases, developers lack direct access to production logs because the organization cannot offer a method for secure access.
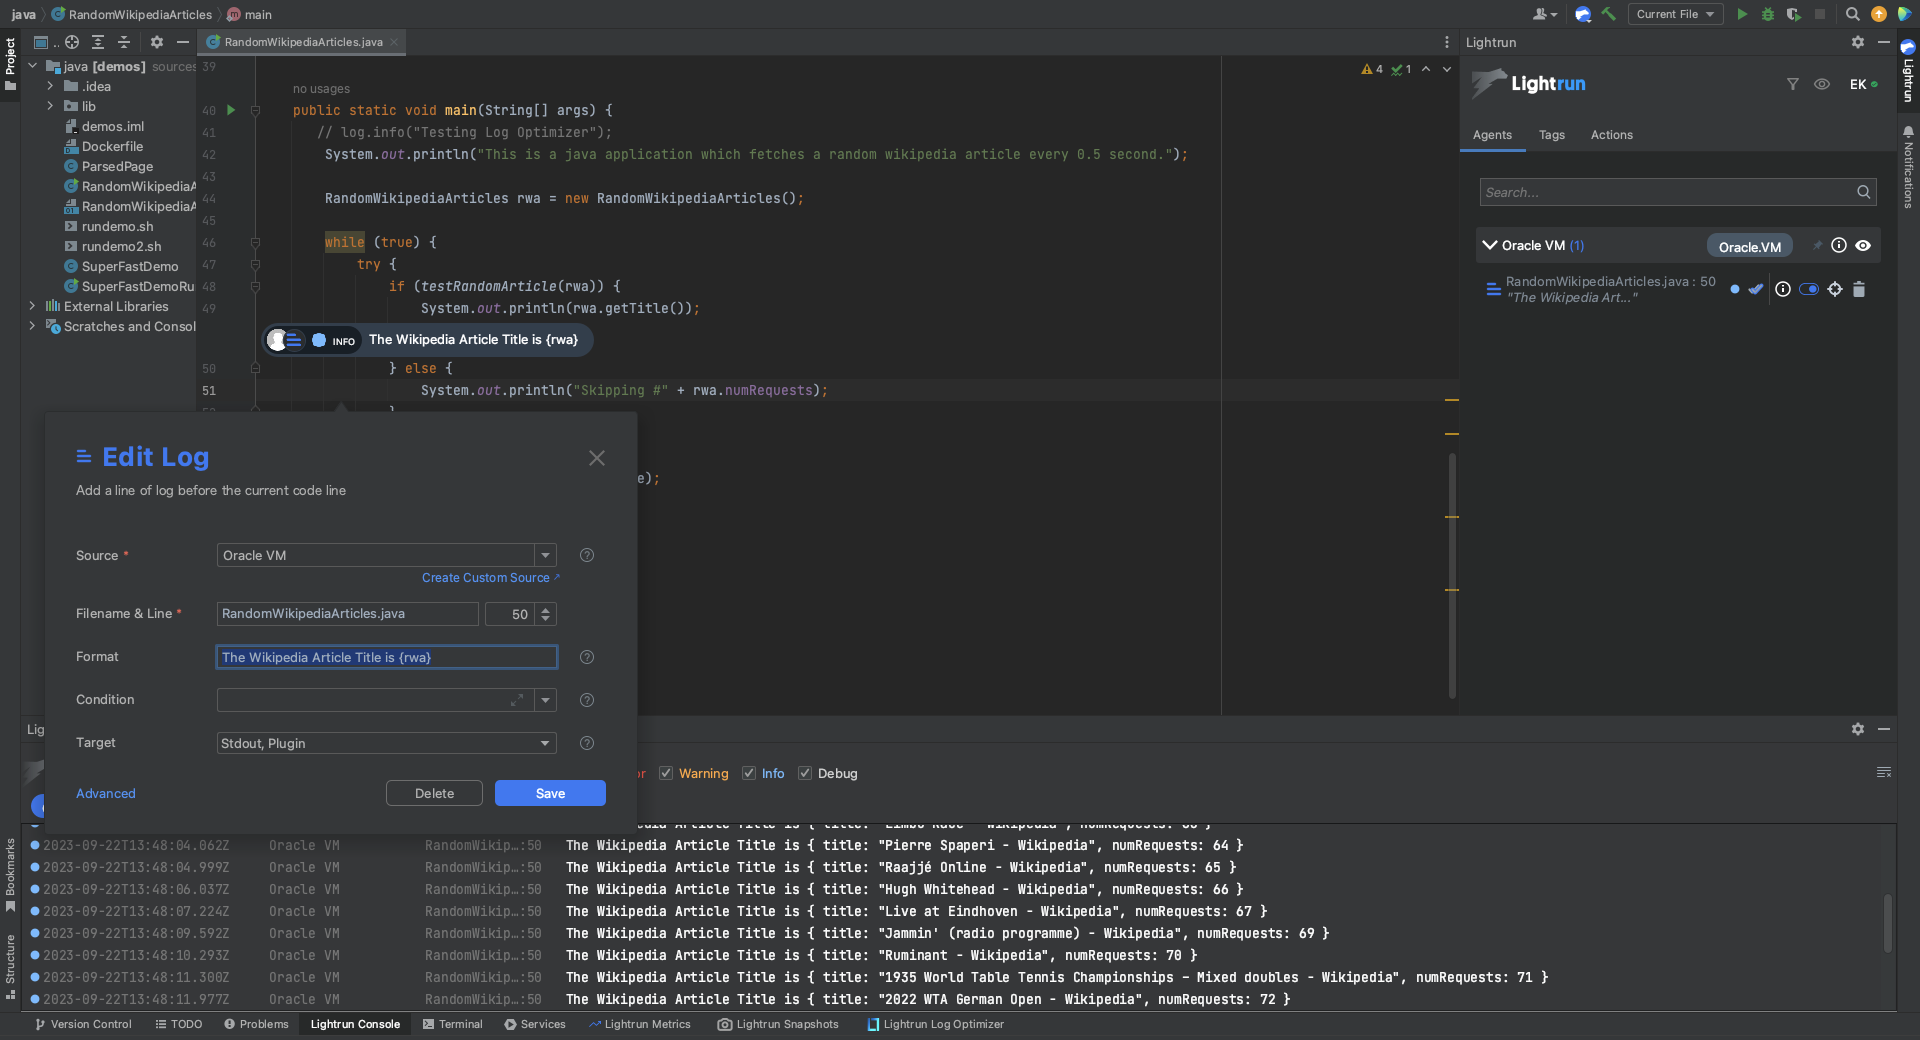
On the other hand, Lightrun Dynamic Logging enables developers to add new logs without halting the application. This ensures uninterrupted access to crucial data directly from the developer IDE. There’s also the possibility to log only when a specific code-level condition is true, significantly reducing the amount of information that needs to be evaluated to pinpoint an issue.
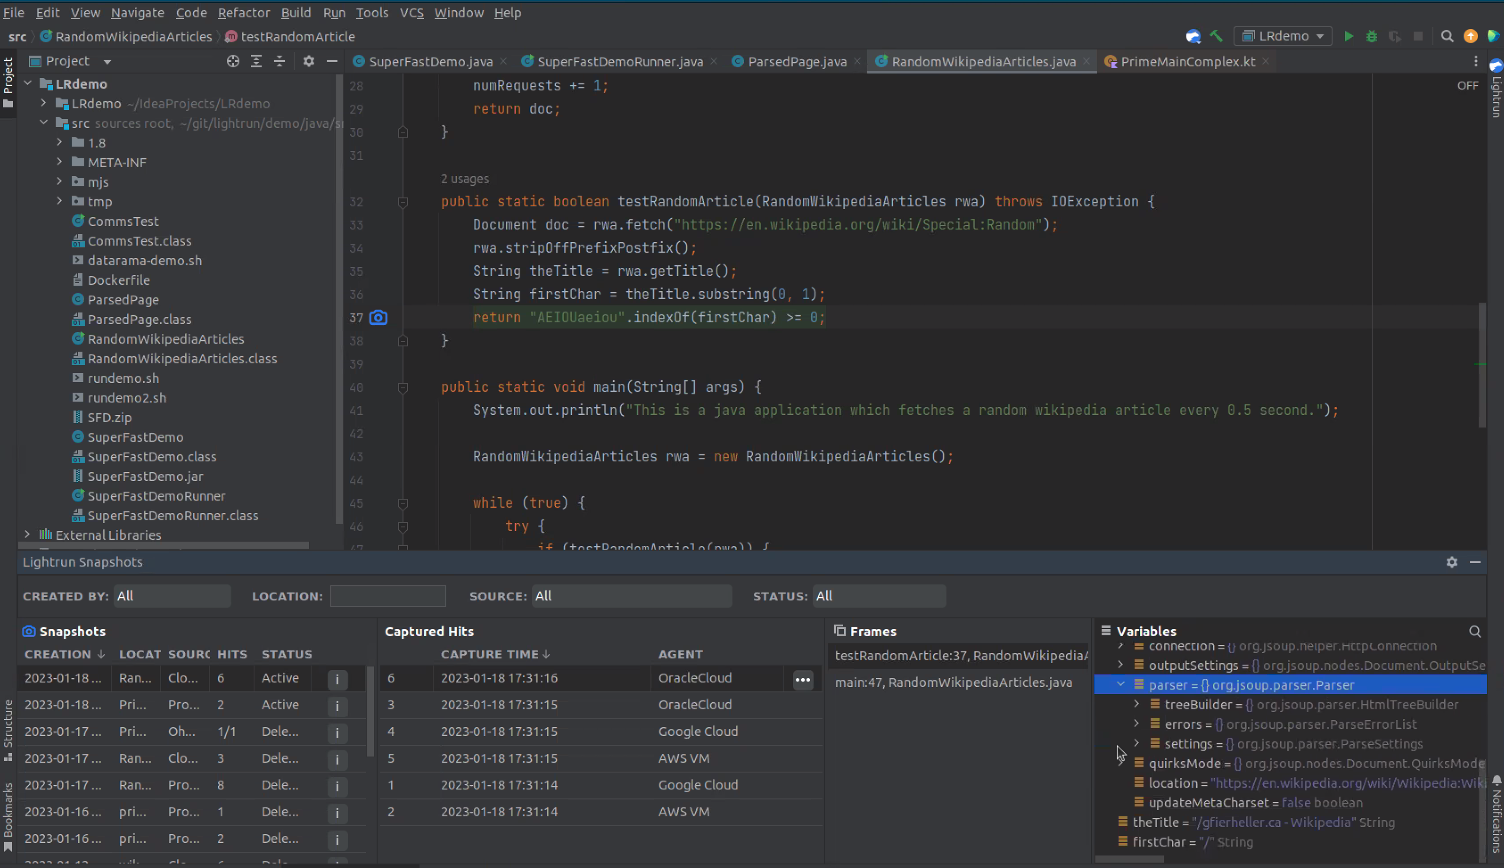
Pillar 2. Snapshots
Traditional debugging methods often involve a fragmented approach: logs for raw data, metrics for system health overviews, traces for request flows across services, and the occasional breakpoint to dive deep into a specific problem. While each tool offers its distinct advantage, developers often find themselves bouncing between them, trying to piece together a comprehensive understanding of what’s happening within their code. This approach can slow debugging and leave significant gaps in understanding, especially when attempting to correlate high-level data and specific code behaviors. Also, the powerful debugging model where the developer can put breakpoints in the applications can not be directly translated into running live applications, as you can not block them easily.
On the other hand, Lightrun Snapshots introduce a paradigm shift in the debugging process by acting as virtual breakpoints that don’t disrupt the flow of application execution. Unlike traditional breakpoints, which halt execution for inspection, Lightrun Snapshots seamlessly blend into the running application, allowing developers to add conditions, evaluate expressions, and delve deep into any code-level object without ever having to stop, restart, or redeploy the application. Integrated completely within the developer’s IDE, these snapshots not only offer a debugger-like experience but also enable a deeper connection to live applications by alerting developers when specific code segments are executed. This dynamic and continuous approach to debugging, compatible with a range of platforms like AWS, Azure, and Kubernetes, ensures that developers can gain deep insights into their applications right beside the source code, making debugging more intuitive and efficient.
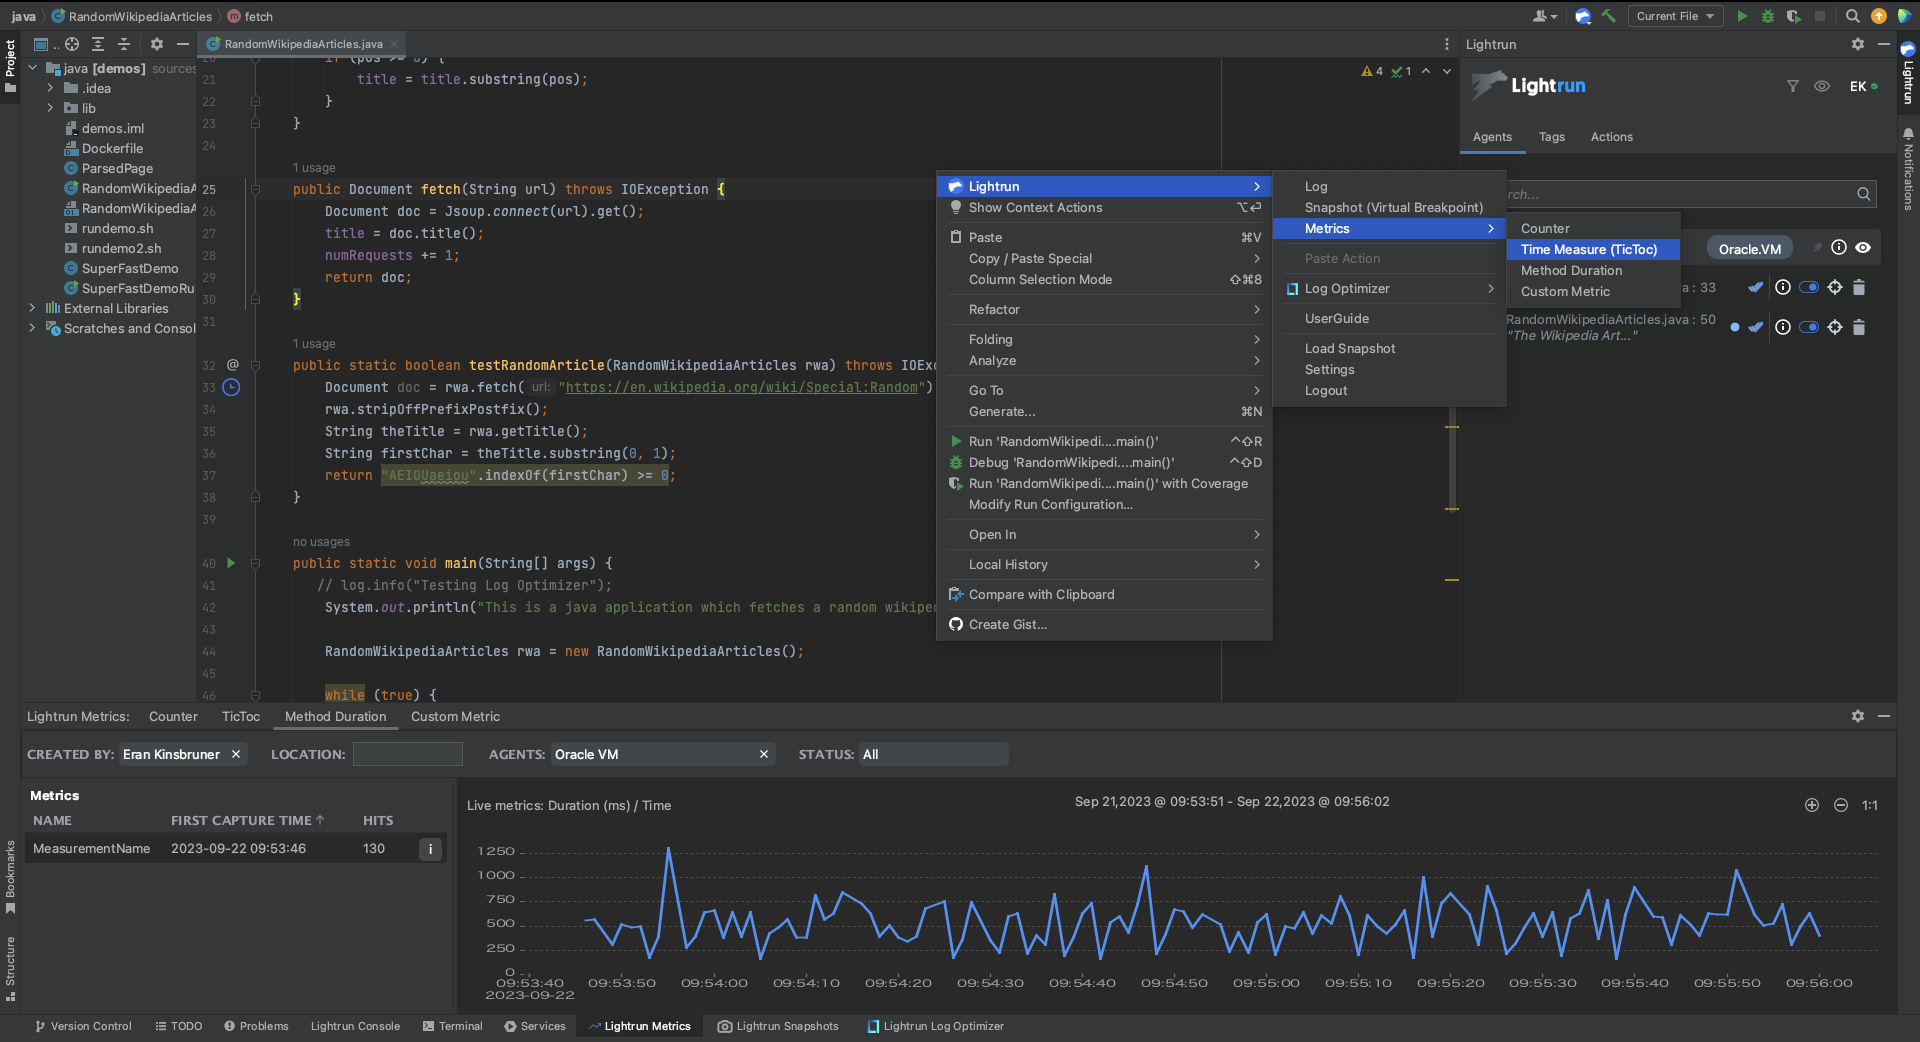
Pillar 3. Metrics
Traditionally, just like with logs, developers have often felt the need to preemptively add many metrics, trying to cover all bases. This scattershot approach not only clutters the telemetry data but also risks overlooking that one critical metric needed during a production issue. Lightrun, however, challenges this paradigm by offering dynamic, code-level metrics. Instead or in addition to instrumenting the application with metrics upfront, Lightrun allows for the real-time insertion of precise metrics directly into live applications, ensuring relevance and accuracy without compromising the execution or state of the application.
With its comprehensive suite of tools, developers can gain insights ranging from the frequency of a specific line being executed with the Counter, to the time efficiency of methods with Method Duration and even block-wise timing with TicToc. Custom Metrics further broaden the scope, granting the freedom to export any numeric expression into a trackable metric.
In Summary
With its suite of features, including dynamic logging, snapshots, and real-time metrics, Lightrun integrates seamlessly with developers’ existing IDEs, positioning itself as an essential ally in the modern development toolkit. If you’re looking to stay ahead in the competitive development space, Lightrun might just be your answer. Dive into its functionalities on the playground, or schedule a demo to experience its capabilities firsthand!