Advancing Observability Maturity: Core Benefits
Feb 12, 2024


Introduction
One of the major trends in software development in the last decade has been “shifting left” responsibilities that have traditionally been under operation’s domain to earlier in the software development life cycle (SDLC). It first came in the form of DevOps where a lot of the software engineering best practices were introduced to the deploy, operate, monitor phases. Such examples include continuous integration and continuous deployment (CI/CD) and Infrastructure as Code (IaC). Then came DevSecOps where security best practices were also baked into SDLC, encouraging developers to think about security while they code and catch vulnerabilities in the build/test cycle instead of finding out after deployment.
Today, enterprises are increasingly shifting observability left, following the footsteps of DevOps and DevSecOps (hopefully we can come up with a better term than simply DevSecObsOps). Given the complex microservices and cloud-native deployment models of modern software architecture, it is no longer feasible to treat observability as solely an operations concern. While observability remains a post-deployment concern for most organizations, the growing divide between developer who write the code (the input) and operators who must monitor and maintain said code (the output) is not only untenable but causing significant impact on both ops (e.g., delayed incident response, higher observability costs) and devs (e.g., lower developer productivity).
In this article, we’ll take a look at why the current model is broken and walk through what shifting observability left in practice looks like. Like DevOps and DevSecOps before, shifting left observability is not just a hot buzz word, but a meaningful shift in how organizations can better utilize observability for productivity gains. It also ties pretty well to the value of developer observability as it relates to amplifying the long term investment in APM tools and the reduction of overall observability total cost of ownership (TCO) including static logging costs.
Advancing Observability Maturity
In recent years, the rise in microservices architecture has put observability in the spotlight. Compared to monolithic architectures where logging and simple monitoring solutions covered a lot of the operational concerns, microservices architectures require organizations to not only monitor their applications, but also the infrastructure it runs on as well as the communication between services. The observability burden explodes exponentially with the number of microservices accompanied by their logs, metrics, and traces to keep up with the lifecycle of events and messages.
While these demands have spurred the growth of observability tooling (e.g., application performance monitoring, distributed tracing, etc), for most organizations, the answer to growing architectural complexity was to overly rely on these instrumentation. In other words, most organizations said, “let’s just log more, generate more metrics, add tracing, and figure it out later.”
Years later, we are now facing the consequences of those decisions. First, the cost of observability has ballooned. It’s common for developers to over-log or for operations teams to forget to turn off debug/tracing logs after investigating an incident to be hit with a hefty bill from their observability provider. Even in normal conditions, high-traffic applications may emit 100s of logs per second, and combined with infrastructure tags that explode cardinality of the logs or metrics, we can easily tax the observability tool with massive storage and compute needs. In fact, most companies now have multiple observability tooling to circumvent some of these issues.
Leaving these real cost concerns aside, the bigger issue with current observability approaches is that it is oftentimes static and reactive. Most of the observability tooling today requires the developers or ops to add logs, metrics, and traces beforehand. If you need to gather more data, you need to make changes to the code or infrastructure and redeploy. Even with the most efficient CI/CD systems, this takes some time to reflect those changes.
Also, it’s not feasible to anticipate all of these observability needs beforehand. Sure, you can attempt to log everything, but not only is that going to be expensive but also create a messy codebase. This puts a mental burden on the dev teams to balance what is worth logging and what is not. For ops, this always leaves a gap in visibility and more importantly, the ability to respond to outages.
Lastly, it is also about the business revenue protection and in that context, when organizations still rely only on APM tools, their ability to reduce the MTTR upon an alert about a production P1 incident is minimal without having the developers engaged and equipped with the right platform.
Shifting Left Observability
So how do we untangle this mess and restore what observability was meant to solve?
Once again, the core idea is to shift left and introduce observability earlier in SDLC. But how does this look in practice?
- Access live data in real time: As mentioned above, current development practices treat observability as a static and reactive process. Developers write code, test it locally, create a PR to run tests on CI, and promote to higher environments. In this typical process, developers do not have access to data from live applications to respond to real life behaviors and address them before getting them to higher environments. Ideally, developers should have access to observability data in real time and integrate that information in the development process.
- Data in context: While traditional observability tooling does a great job in aggregating and indexing data, it is often designed for the needs of ops teams. Most observability solutions have complex dashboards with lots of information across the entire system, but for most developers, they simply need data about the code they are working on. Correlating and narrowing down on the logs, metrics, and traces in the context of the code that a developer is writing will help surface the necessary information.
- Developer native: In a similar vein, observability tooling should work in the natural workflow of development. Instead of forcing developers to open up another dashboard, have the data surfaced in a tab within their IDE. This may seem like a small difference, but context switching kills productivity and keeping everything streamlined is key.
- Dynamic instrumentation: Finally, developers should be able to dynamically add new observability in real time without having to modify the code, go through the typical build and deploy cycle. Not only does this save time in terms of code deployment, but also cost in that developers no longer need to add in static instrumentation just in case they might need it in the future.
End State: Observability-Driven Development
Organizations that continually push observability left come to achieve observability-driven development. In other words, developers adopt an observability-first mindset in developing new applications, which has numerous benefits.
- Developers focus on user experience from the get-go rather than just how the code will operate. Putting observability first means developers are forced to think about how their code will work in production and how it will be measured. For example, what is the minimal response time needed for the API for a positive user experience? Knowing this constraint, what are the other dependencies we need to consider to make sure the application is performing at a high level. Finally, in extreme load, what fallback mechanisms do we have to mitigate cascading failures?
- Shifting observability left also enhances the quality of tests. Not only do developers now have real-life data for their code changes, but new interactions can be modeled by how it can be measured and in turn that data can be collected to drive realistic tests.
- Debugging and incident management also get a boost. Developers can debug their logic with dynamic instrumentation within their existing workflows (i.e., from their IDE) without having to break glass and as a result continuously reduce the P1 issues that slip to production. Operations can also reduce their mean-time-to-resolution (MTTR) since observability is no longer about having to sift through large amounts of data but rather a targeted investigation to find the issue. Lastly, such practice improves the overall business revenue at risk protection.
- Finally, developer productivity increases as they no longer need to write messy code to inject static observability or waste deploy cycles in order to simply collect more data.
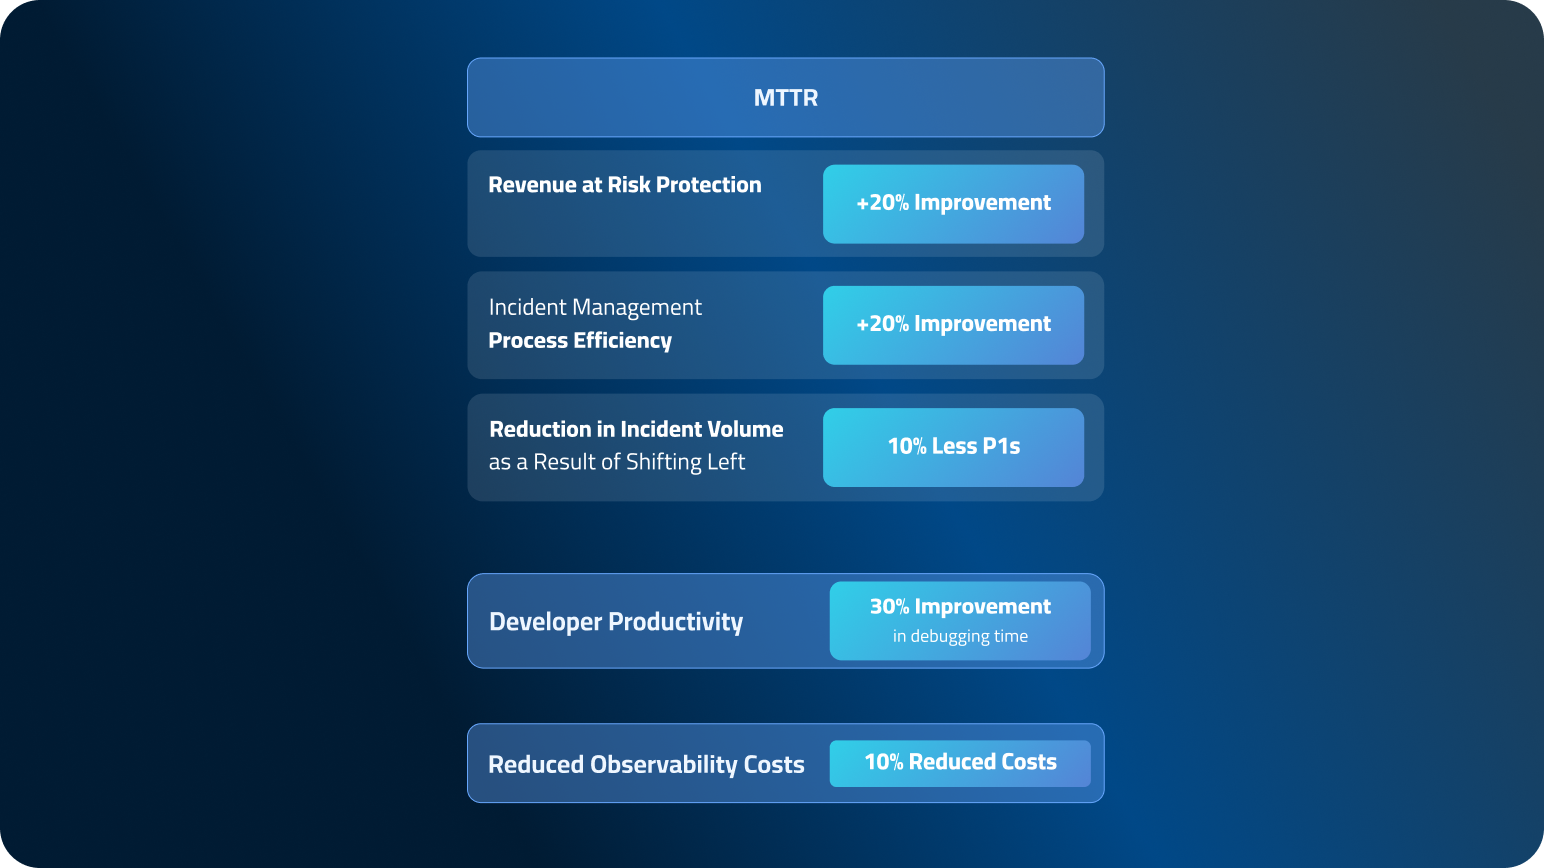
Here is a real-world example of the tangible outcomes achieved by one of Lightrun’s clients through the implementation of the platform and the strategic shift left observability. The benefits derived from this adoption can be categorized into three primary pillars:
- MTTR (Mean Time To Resolution):
- Enhancement in revenue protection and risk mitigation.
- Improved efficiency in incident management.
- Reduction in the volume of critical P1 incidents.
- Developer Productivity:
- Significant reduction in developers’ debugging time.
- Reduction in Overall Observability Costs:
- Decreased expenditure on static logs.
- Lower total cost of ownership (TCO) for APM tools through the adoption of Lightrun
Final Thoughts
Shifting left observability is a growing trend in high-performing software engineering teams who have realized that the state of static and reactive observability is untenable. Simply logging more and dealing with it later is causing a huge burden on both development and operation teams.
By introducing observability earlier into SDLC, high-performing teams are not only writing cleaner and better code, but also reducing the operational burden in debugging, responding to incidents, and dealing with a sheer volume of observability metrics.