
Streamlining Debugging with Lightrun Snapshots: A Superior Alternative to Trace Logging
Introduction
According to a recent study, failing tests alone cost the enterprise software market an astonishing $61 billion annually. This figure mirrors the vast number of resources devoted to rectifying software failures, translating into about 620 million developer hours lost each year. On average, engineers spend 13 hours to resolve a single software failure, a statistic that paints a stark picture of the current state of debugging efficiency.
Further compounding this issue, another research piece reveals that software engineers dedicate 50% of their time to debugging activities. This significant investment of time underscores the inefficiency entrenched in traditional debugging practices, where the prevalence of bugs and the complexity of modern software systems necessitate continuous, often tedious, error resolution efforts.
Moreover, further insights from Coralogix paint a detailed picture of the debugging landscape: On average, a developer introduces 70 bugs for every 1,000 lines of code, and remarkably, 15 of these bugs per 1,000 lines find their way to customers. The effort required to fix these issues is substantial, as fixing a bug takes 30 times longer than writing a line of code. Consequently, developers spend 75% of their time debugging according to the same source. This translates to approximately 1,500 hours each year. Financially, this inefficiency is costly, with the U.S. alone spending an estimated $113 billion annually on identifying and fixing product defects.
These statistics effectively underscore the high cost of debugging in software development, but what if there was a more efficient way to streamline this process, make it more effective, and less time-consuming?
The State of Debugging in Modern Software Development
The current debugging landscape is characterized by a myriad of tools, approaches, and methodologies that aim to streamline the process of identifying and resolving software defects. Traditionally, debugging has been synonymous with the use of debuggers and logging tools, which help developers trace code execution and identify errors.
With the rise of modern software architectures, such as cloud-native applications and microservices, the complexity of software systems has increased exponentially. New tools and methodologies have emerged to address these challenges, such as distributed tracing, part of the observability stack, which helps developers monitor and trace requests as they traverse multiple services.
Another common practice that has gained traction in the modern engineering world is the concept of testing in production, where developers and operations engineers collaborate to make testing more efficient in a controlled production environment. This approach uses several tools and techniques, such as feature flags, canary releases, A/B testing, chaos engineering, load testing, and synthetic monitoring, to ensure that software is tested thoroughly before being considered 100% safe for production.
While these methodologies and tools are trending, it’s important to recognize that they do not provide universal solutions to all challenges but mainly application-level observability and debugging. Indeed, despite their advantages, less emphasis has been placed on application-level observability – a critical aspect that extends beyond monitoring and tracing requests in distributed environments.
The term “observability” in the context of modern software often refers to monitoring and tracing at the infrastructure and service level. This approach, while valuable for understanding system-wide behavior, may not sufficiently address the needs of developers at the application level. Developers require granular insights into how their code performs in production, beyond just tracing execution paths and using trace-level logs – two common practices that are traditionally used for debugging.
Also, with the shift-left movement, developers now shoulder more responsibilities earlier in the development lifecycle, including testing, deployment, and monitoring. While empowering to the whole company, this shift can inadvertently divert focus from their traditional core responsibility: ensuring the robustness and functionality of the application itself.
Application-level observability has not evolved significantly compared to its infrastructure-focused counterpart. It remains largely confined to development environments, relying on techniques like code profiling and trace analysis during debugging phases. For example, developers can use debuggers and execution traces when a complex bug arises, but this is often not feasible in production environments due to the performance overhead they introduce. As a consequence, developers lack adequate tools and methodologies to observe and diagnose application behavior in production environments effectively.
To address this gap, there is a growing need for tools that provide comprehensive application-level observability in production. This includes the ability to capture and analyze code execution and add logs on-demand without either affecting performance or requiring code changes and redeployment. Such tools, equipped with advanced live debugging and dynamic instrumentation capabilities, can significantly complement existing observability and testing in production methodologies.
Introducing Lightrun: Live Debugging for Modern Software Development
Lightrun is an innovative developer observability platform that provides live debugging and dynamic instrumentation tools for modern software environments. It enables developers to locally and remotely debug applications in different environments, including production, without the need for code changes or redeployment. The platform offers a range of features, mainly Dynamic Logs and On-Demand Snapshots, that empower developers to observe and diagnose application behavior in real-time.
The Dynamic Logs feature enhances the way developers interact with logs. Unlike traditional logging methods that require code modifications and redeployments, Lightrun allows developers to insert new log lines dynamically, on-demand, and in real-time.
The On-Demand Snapshots feature provides virtual breakpoints that enable developers to capture code execution snapshots without stopping the application. This feature allows developers to evaluate expressions, inspect objects, and troubleshoot issues across different environments, including public cloud platforms and on-premises setups.
Dynamic Logs: Precise Logging for Efficient Debugging
Lightrun’s Dynamic Logs have many advantages over traditional logging methods, including:
Seamless Integration Across Environments
Lightrun seamlessly integrates across diverse cloud platforms, including AWS, Azure, GCP, Kubernetes, serverless architectures, and on-premises setups. This capability empowers developers to troubleshoot and monitor applications across multiple environments without the need to switch tools, thereby enhancing productivity and accelerating issue resolution.
Precision and Flexibility in Logging
Developers can insert logs based on specific code-level conditions and trigger them during runtime, providing precise instrumentation for capturing relevant diagnostic information. This approach optimizes debugging efforts by ensuring that logs are generated only when necessary, without overloading the application with excessive logging.
Performance and Security Assurance
All logs added through Lightrun are designed to be performant, read-only, and secure. They do not impact the runtime performance of the application and adhere to strict security protocols to protect sensitive data during logging operations.
Cost Optimization and Operational Efficiency
Lightrun helps organizations optimize logging costs by minimizing over-logging during development. By focusing on essential diagnostic information and providing local visibility into remote applications directly from the IDE, Lightrun enables efficient troubleshooting and reduces operational expenses associated with logging.
On-Demand Snapshots: Real-Time Application Observability and Debugging
In addition to Dynamic Logs, Lightrun’s On-Demand Snapshots feature offers many advantages over traditional debugging methods. Here are some key benefits:
Non-Disruptive Virtual Breakpoints
Lightrun Snapshots introduce virtual breakpoints that allow developers to inspect the state of their application without halting its execution. This ensures minimal impact on the end-user experience and maintains application uptime by enabling non-disruptive debugging. Developers can dynamically add these snapshots to live applications without the need for restarts or redeployments, providing a seamless and efficient debugging process.
Detailed Code-Level Insights
Offering deep insights into the application at a code level, Lightrun Snapshots enable developers to evaluate expressions and inspect any code-level object. This feature supports troubleshooting across various environments, including AWS, Azure, GCP, Kubernetes, serverless, and on-premises setups. The granular detail provided by these snapshots helps in identifying and fixing issues more effectively.
Safe and Performant Operations
Unlike many traditional approaches to creating breakpoints and debugging, all snapshots are read-only and do not interfere with the application’s performance. This ensures that the live application runs smoothly while developers can insert and consume snapshots directly within their IDE. This integration within the IDE maintains a consistent workflow, improves the work environment, and reduces the learning curve.
Precise and Scalable Monitoring
Lightrun Snapshots can be added based on various code-level conditions and triggered when the specified code is executed. For example, you can add a snapshot to monitor a specific user interaction or a critical section of code. This capability supports precise and scalable monitoring. Multiple developers can add multiple snapshots to the same application, not only to monitor different sections of code but also to collaborate on debugging efforts.
Continuous Real-Time Execution
Unlike traditional breakpoints, Lightrun Snapshots do not pause the application. Instead, the execution continues, allowing subsequent snapshots to be hit continuously. This enables real-time monitoring and comparison of snapshots over time to observe changes in variables and data structures. This is why Lightrun Snapshots make it faster to detect complex issues and resolve them efficiently.
Enhanced Collaboration and Integration
Snapshots can be shared with other developers through various integrations, promoting collaborative debugging and issue resolution. This fosters a collaborative environment among development teams, enhancing problem-solving efficiency and accelerating the debugging process. By leveraging shared insights, teams can collectively address hard-to-find bugs and optimize application performance.
An Example Use Case: Debugging a Production Issue
Let’s consider a scenario where a developer encounters a production issue. The application was successfully deployed using the code below. The application is a simple Flask web application that calculates the Body Mass Index (BMI) of a person based on their height and weight.
We are using code that is susceptible to errors because it performs a division without checking if the height is different from 0. This kind of check can be easily forgotten, especially when the code is complex and the developer is in a hurry.
The code below can be deployed to production; this does not matter as Lightrun will give you insights about your remote environment from your preferred IDE. Notice that the application uses lightrun with Production as a tag. This tag is used to identify the environment in which the application is running, and it should be configured based on the environment in which the application is deployed. The lightrun.enable function is used to enable the Lightrun agent in the application.
You should also replace <YOUR_COMPANY_KEY> with your company key, which you can obtain by signing up for a Lightrun account.
import json

try:
  import lightrun
  lightrun.enable(
      company_key='<YOUR_COMPANY_KEY>',
      com_lightrun_server='<https://app.lightrun.com/>',
      metadata_registration_tags='[{"name": "Production"}]'
      )
except ImportError as e:
      print("Error importing Lightrun: ", e)

app = Flask(__name__)

@app.route('/', methods=['GET', 'POST'])
def index():
    if request.method == 'POST':
        name = request.form['name']
        height = request.form['height']
        weight = request.form['weight']

        # Process the data
        result = process_data(name, height, weight)

        # Render the result template
        return render_template('result.html', result=result)

    # Render the input template
    return render_template('input.html')

def process_data(name, height, weight):
    # Print the BMI of the person
    bmi = str(int(weight) / (int(height) / 100) ** 2)
    result = "Hello " + name + ", your BMI is " + bmi
    return result


if __name__ == '__main__':
    app.run(debug=True, host='0.0.0.0', port=5000)
The code is a Flask app with a single route at the root URL (‘/’), which accepts both GET and POST requests. If the request method is POST, the app retrieves the data from a form (name, height, and weight), calculates the BMI (Body Mass Index) of the user using the process_data() function, and renders the result.html template with the result.
If the request method is GET, the app simply renders the input.html template, which contains the form. The process_data() function takes in the name, height, and weight of a person, calculates their BMI, and returns a string containing their name and BMI.
The line bmi = str(int(weight) / (int(height) / 100) ** 2) is the one that performs the division. If height is 0, the program will crash.
While the fix is easy (just check if the height is different from 0), it is sometimes hard to find the root cause of the errors. If you are a developer, you have certainly spent hours debugging your code to finally find that it was a simple typo or a missing check. We’ve all been there at least once!
In certain cases, you will need to clone the code repository, install the dependencies, run the code, and then debug it before redeploying and testing it. This can be a lengthy process, and it can be especially frustrating when you don’t fix the bug on the first try.
The above code is in production – this could be a container running inside a Pod in a Kubernetes cluster, an on-premises server, or a serverless function running in the cloud. Using Lightrun, all you have to do is open your IDE, add a log line, and test the application again. No need to redeploy. This is what we call dynamic logging. Let’s see it in action.
We are using VSCode in this example, but you can use other IDEs such as JetBrains IDEs, VScode.dev (the web version of VSCode), or code-server.
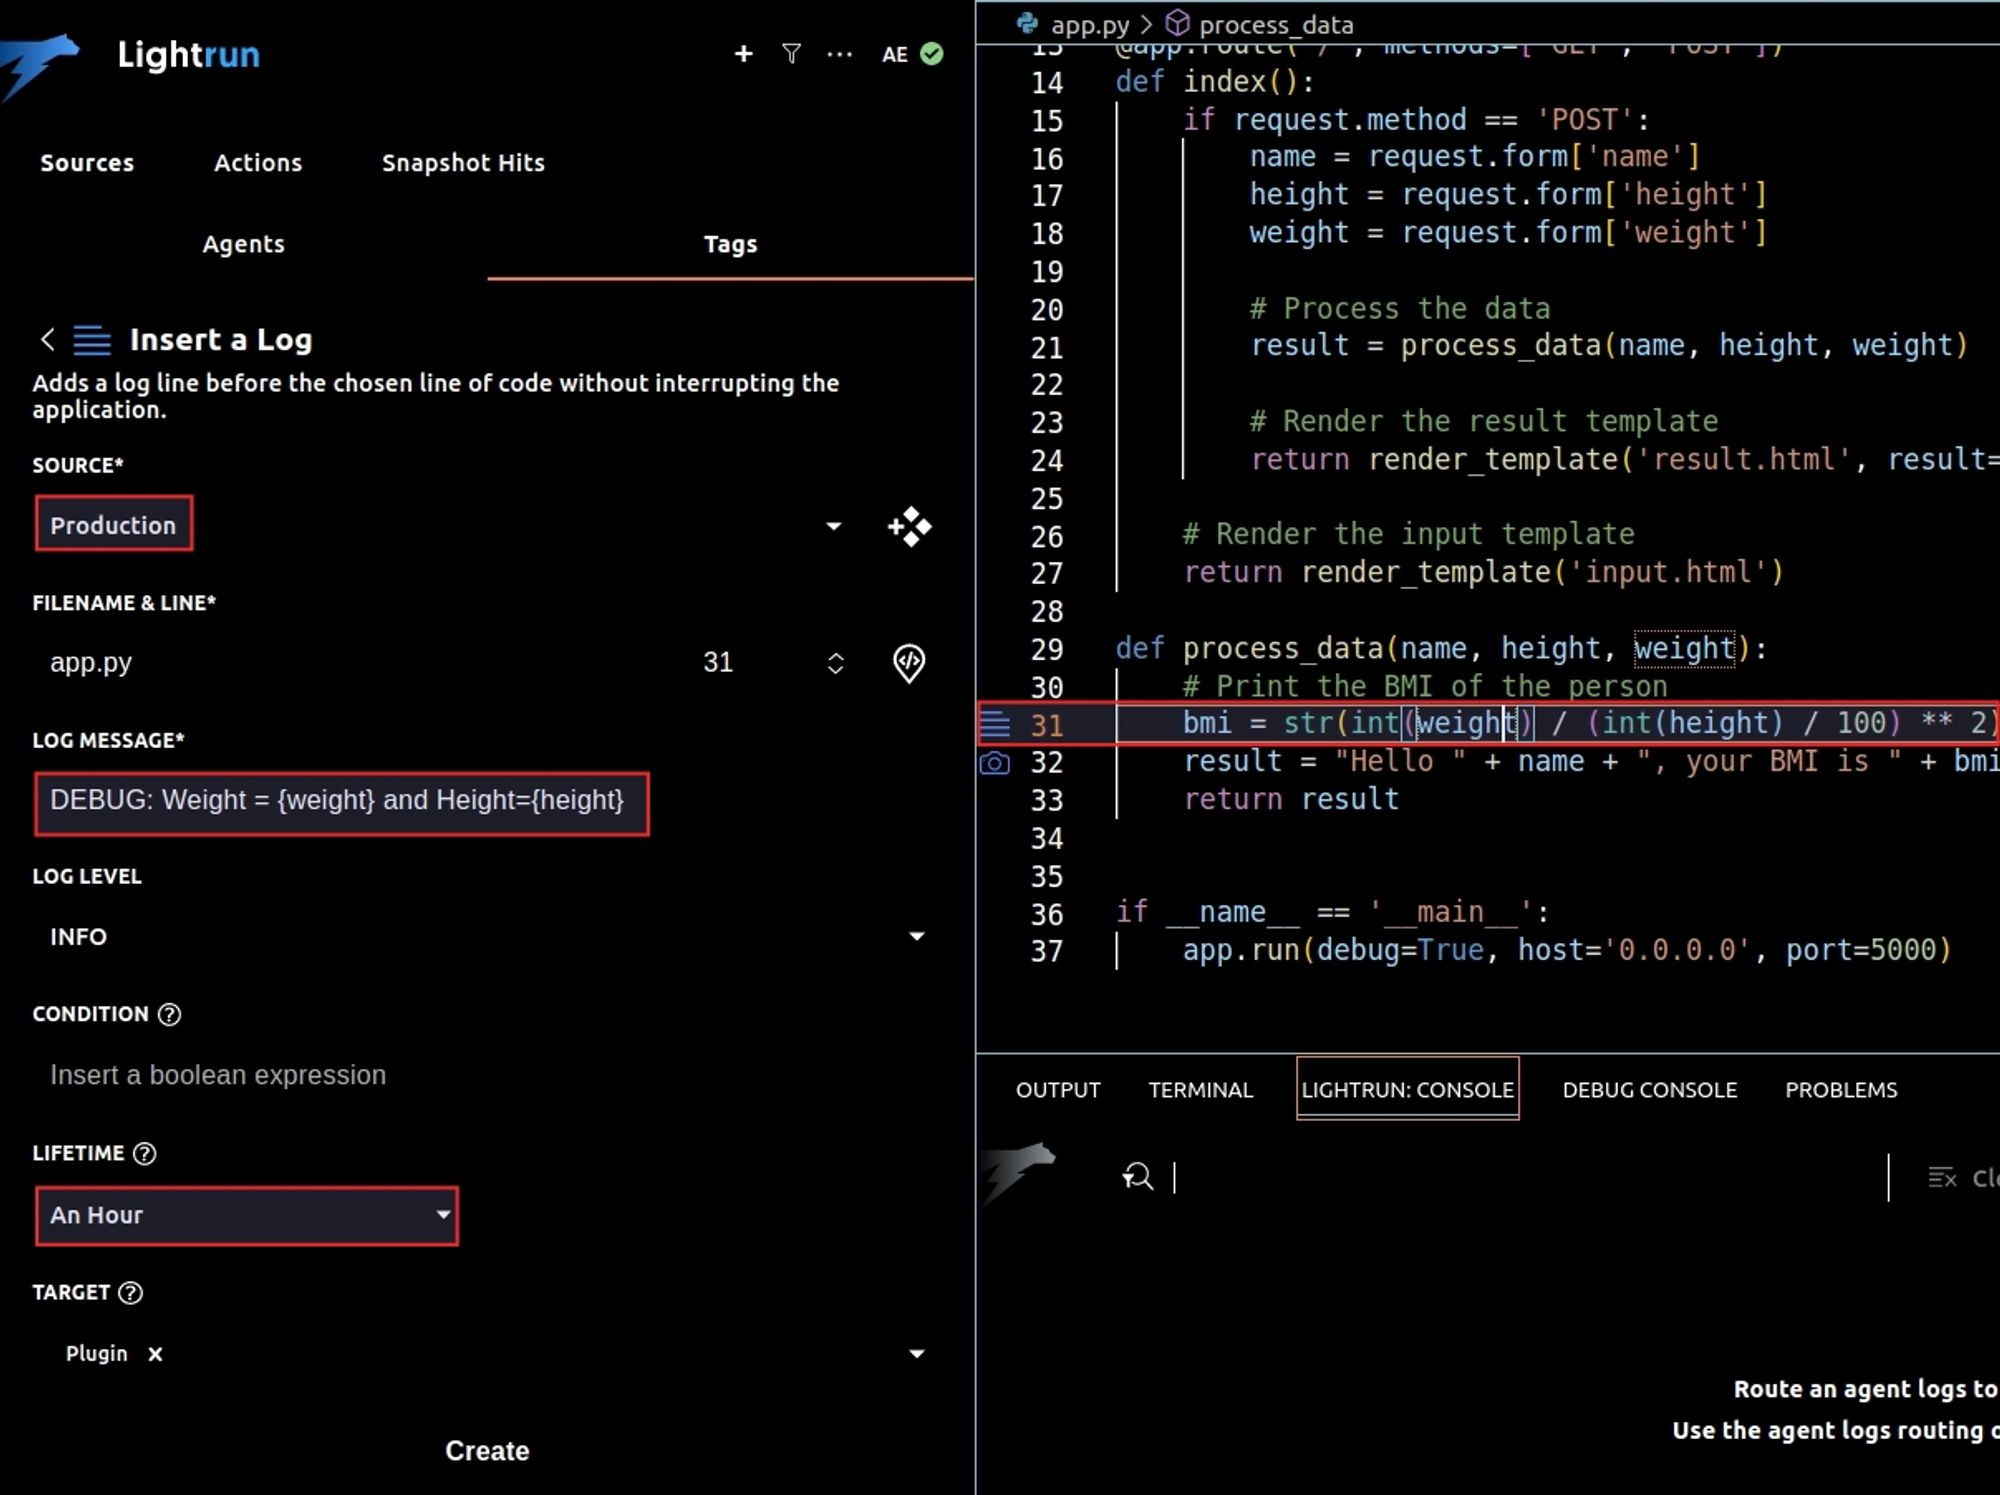
If you are following along with VSCode, you have to install the Lightrun plugin for VSCode, then go to the code line where you want to add the log, right-click on it, select Lightrun, then Insert a log.
You can then access the variables (weight and height) and add a log that will print them.
You can also select the environment in which you want to add the log line. In our case, we are using the production environment, but it can be any other environment such as staging, development, or any other custom environment.
To avoid flooding your logs with too much data, you can configure the log line to stop capturing data after a certain time.
Lightrun Dynamic Logs Example
Once you have added the log line, the generated output will be available in both the Lightrun dashboard and the panel of the Lightrun plugin in your IDE. You can also see the logs in the VSCode terminal (Lightrun tab).
If you want to make your log line conditional, you can add a condition to it. Let’s say you only want to log the values of weight and height if height is different from 0. You can add a condition to the log line and define the condition as height != 0. This way, the log line will only be executed if the condition is met.
Logs are useful, especially with Lightrun, where you can add them dynamically. But sometimes, you need more than just regular logs. You might need to see the values of variables at a certain point in time or understand the execution flow of your application—like which calls are made, which functions are executed, in what order, and who calls whom. This is where breakpoints or application-level traces come in handy. With Lightrun, you can use snapshots to achieve this and more.
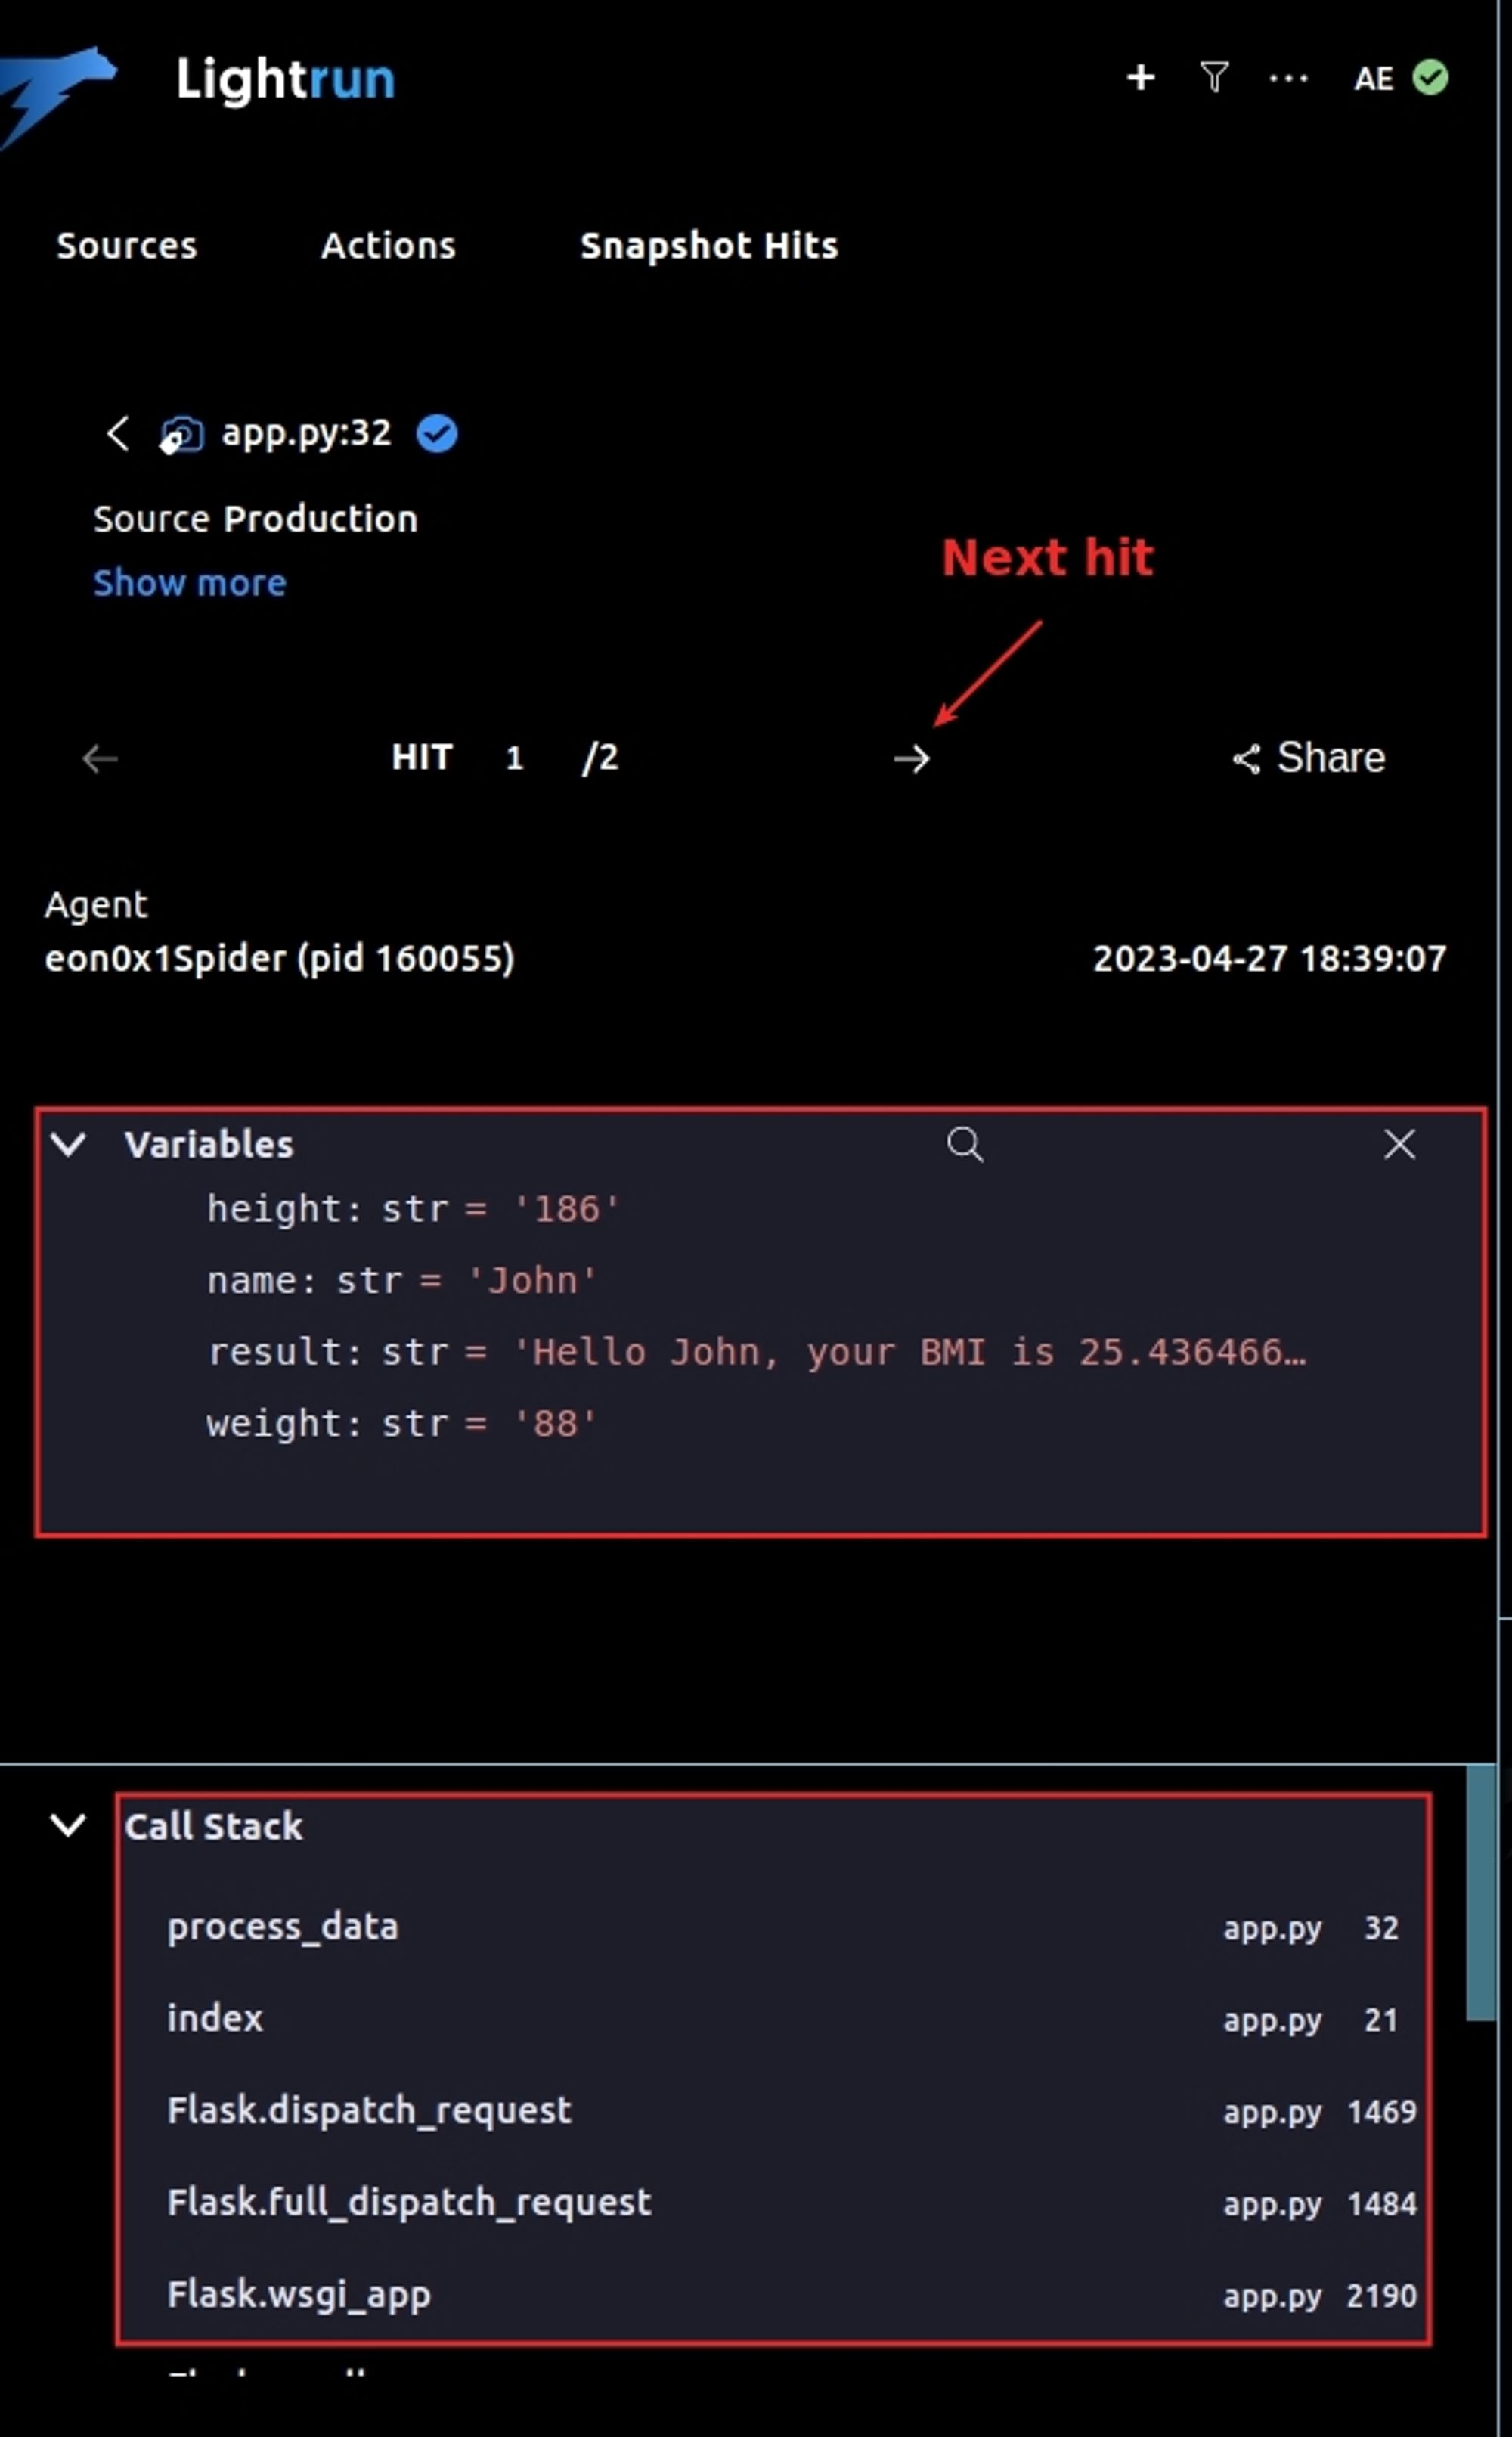
For example, if we add a snapshot to the line result = "Hello " + name + ", your BMI is " + bmi, Lightrun will capture application-level traces at that line. We can then see the values of the variables and the execution trace. This helps us understand the execution flow and the variable values at a specific point in time without stopping the application.
We can also iterate through all the snapshot execution hits and see the values of the variables at each execution. This can be done by clicking on the Next button on the snapshot panel.
Lightrun Snapshot Example
The call stack, representing the different methods and functions that are called, is also available in the snapshot panel, which gives us an overview of the execution flow of our application.
Compared to traditional execution traces, Lightrun snapshots are cleaner, more readable, and easier to use and understand.
Breakpoints that Don’t Break: A Superior Alternative to Traditional Debugging
By using dynamic snapshots in a live environment, we can debug our application in production like it was running locally. At a certain point in time, we can see the values of the variables, the execution traces, and the call stack. At the same time, we can add conditional snapshots, which will only be triggered if a certain condition is met.
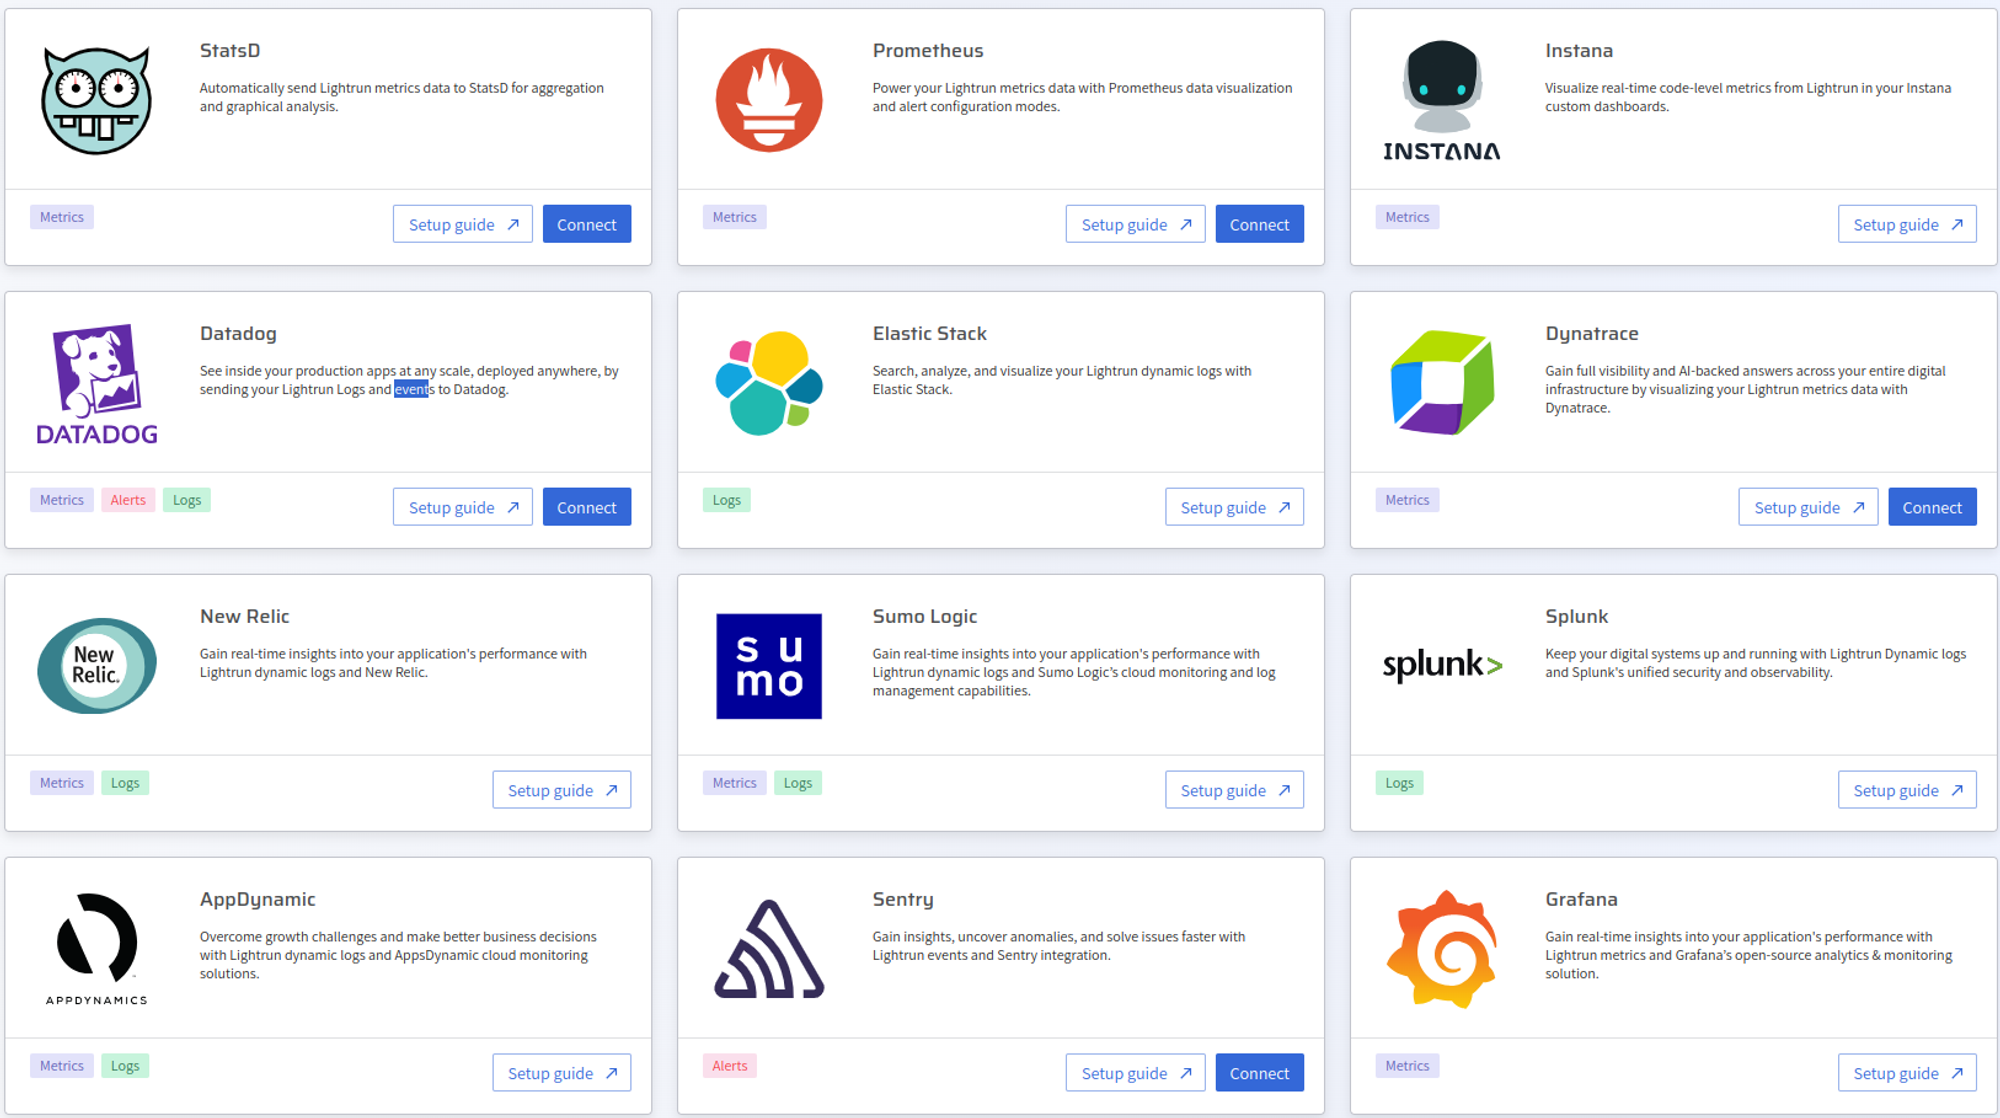
You can also integrate Lightrun with your favorite tools, such as Slack, DataDog, and more. For example, you can connect Slack to Lightrun in order to help your team collaborate by receiving alerts and notifications from Lightrun. This can be useful in the following scenarios:
- A new user is registered in the system
- A new agent is registered in the system
- An action is inserted/deleted by a user
- An agent is removed from the system
- Configured exception notifications
Lightrun Supported Integrations
If we had to do this without Lightrun, we would have to clone the code repository, install the dependencies, run the code locally, reproduce the bug, and then debug it. This operation will also involve installing a debugger, setting breakpoints, and stepping through the code. This can be a lengthy process, and it can be especially frustrating when you don’t fix the bug on the first try or when the bug is not reproducible locally.
Snapshots are a superior alternative to traditional debugging and application-level tracing. They provide a more efficient and effective way to developer observability and live debugging in remote environments, including production.
Add to this the dynamic logging feature, and you have a powerful and complete application observability platform that covers all your needs in terms of dynamic instrumentation.
To see how Lightrun can help you, you can request a demo. Alternatively, take a look at the Playground where you can play around with Lightrun in a real, live app without any configuration required.
It’s Really not that Complicated.
You can actually understand what’s going on inside your live applications.


