

Your AI agents can finally see live production
Lightrun’s inline runtime sensor gives agents and agentic workflows the ground truth to validate new code, investigate live systems, and remediate issues with precision.
-
 Power IDEs & AI Agents
 -
 Debug Live Production
 -
 Validate Before Release
 -
 Performance Analysis
-
Runtime-Verified RCA
-
Triage & Route Alerts
-
Fix Recommendations & Postmortems
-
Code Deep Research
Trusted by Fortune 500 engineering teams


AI cannot fix what it cannot see
Traditional observability was built for humans debugging after the fact.
It was not designed to provide feedback in real time.

Runtime-aware
development
development
Code that passes staging breaks in production. Instability is up 10%

Evidence-based
issue resolution
issue resolution
Remediation is stuck on educated
guesses.

Secured autonomous
workflows
workflows
Autonomous workflows risk production drift.
Make live execution your source of truth
Ground your AI agents and AI SRE in real execution across code, infrastructure, and live production systems.
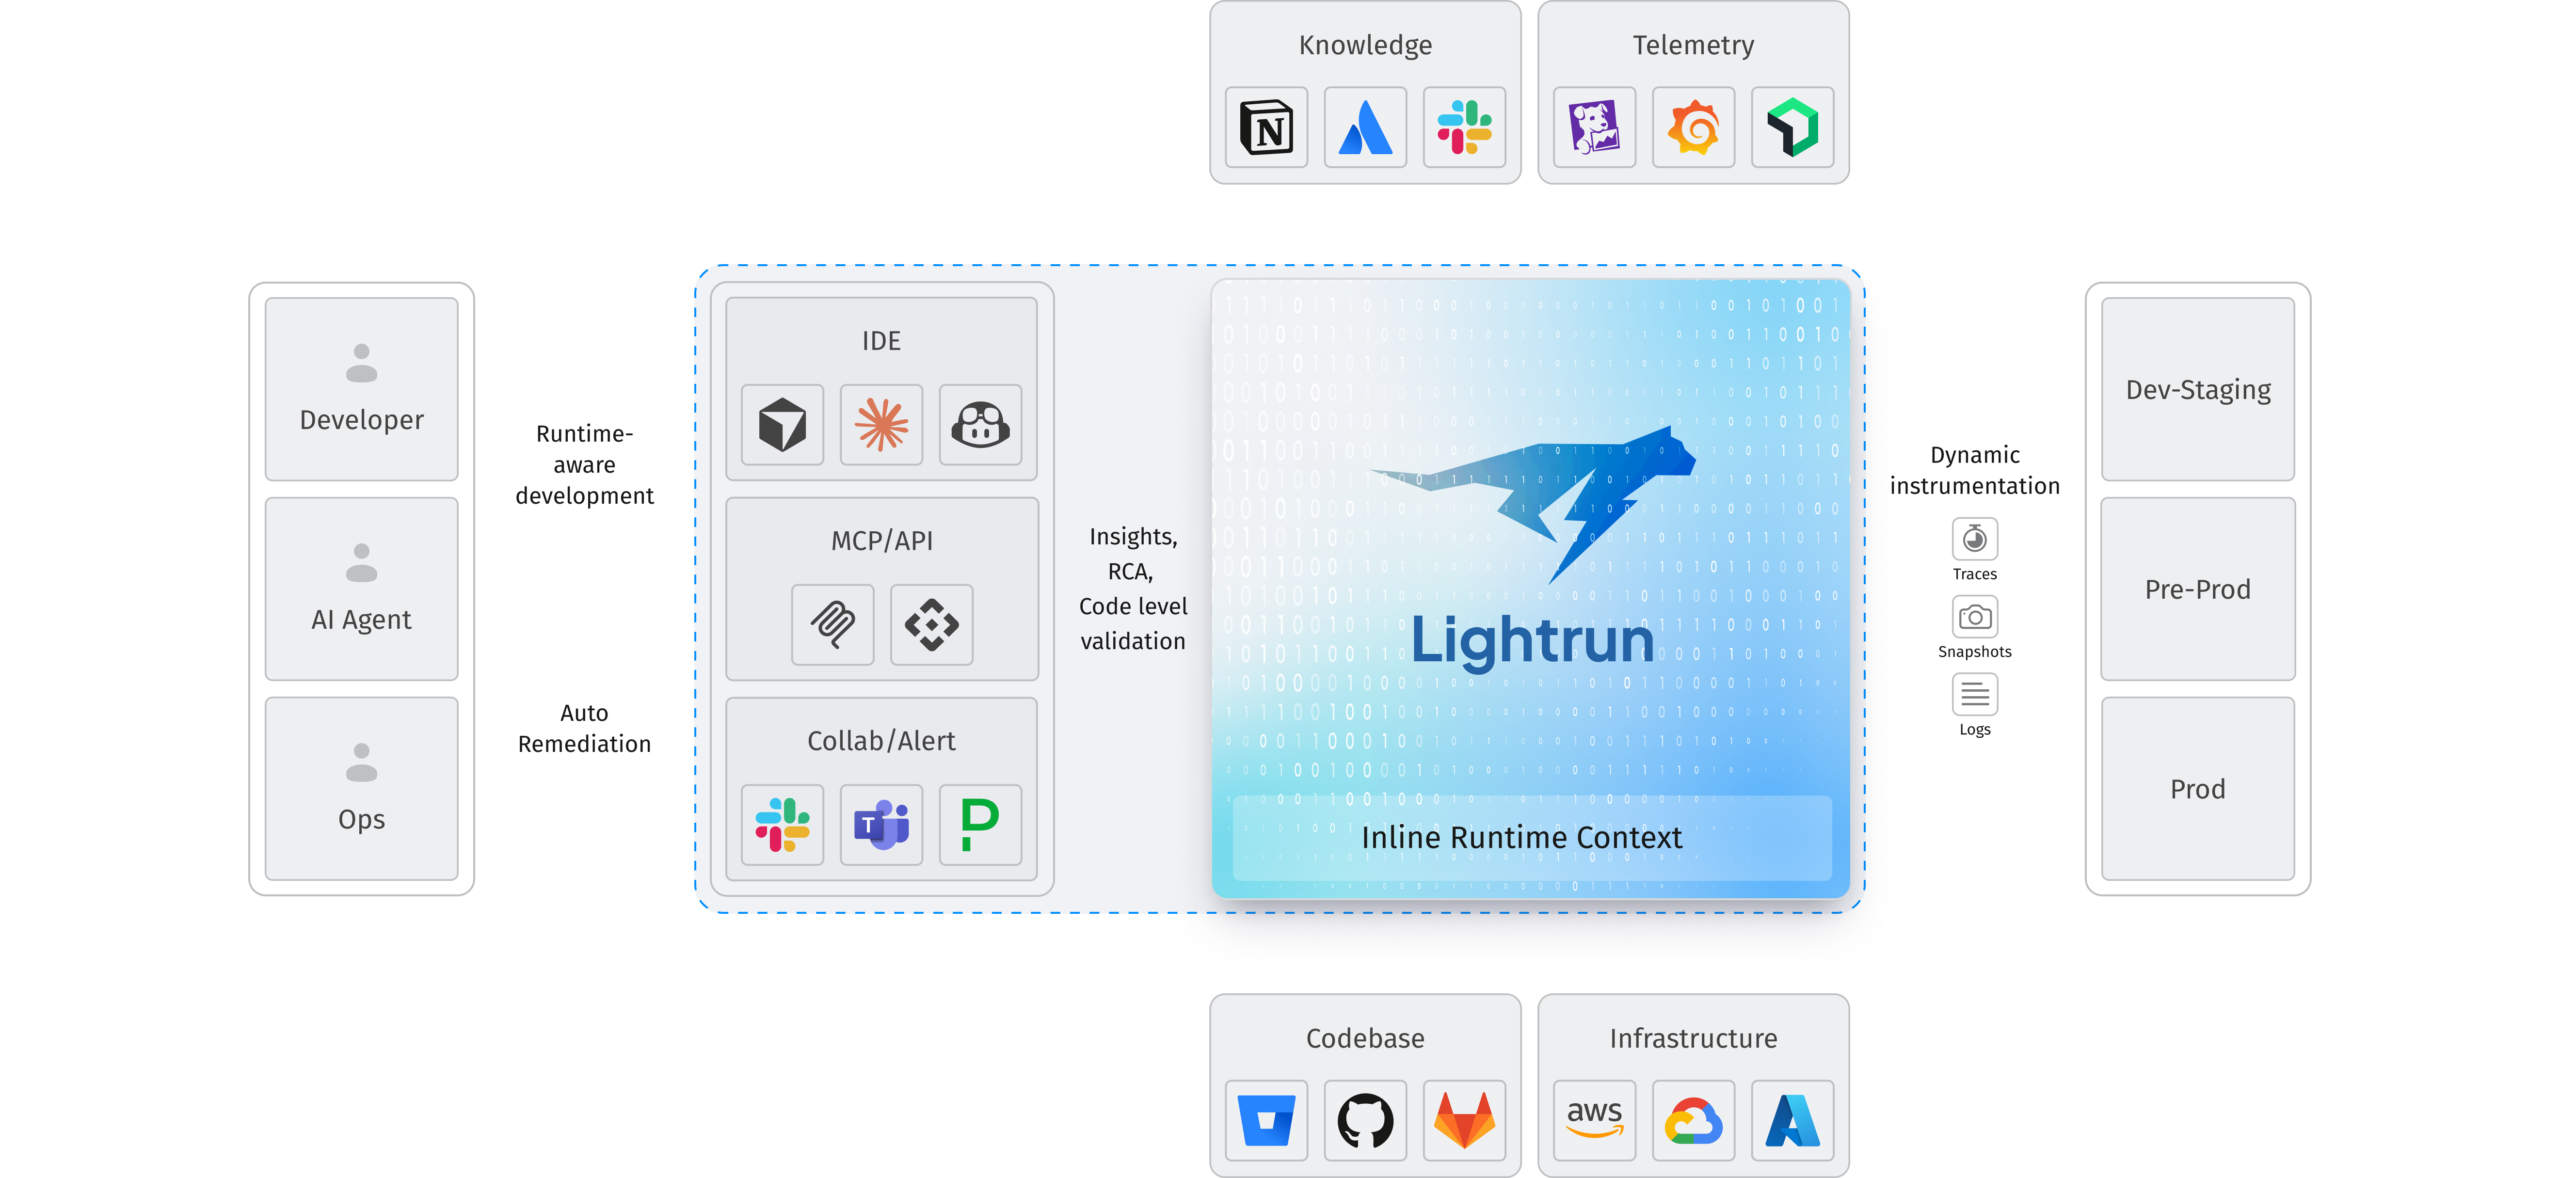
Embed reliability across the accelerated SDLC
One runtime sensor that grounds your coding agents and AI SRE.
Verify every change
with live context
Connect your AI agents and IDEs to live execution data, so every change is designed and tested against real system behavior.
 Gemini
 Amazon Q
 Codex
Codex
 Windsurf
 Claude Code
 Cursor
 Antigravity
 GitHub Copilot
 Kiro
Kiro
 Junie
Gemini
Amazon Q
Codex
Windsurf
Claude Code
Cursor
Antigravity
GitHub Copilot
Kiro
Junie
Junie
Gemini
Amazon Q
Codex
Windsurf
Claude Code
Cursor
Antigravity
GitHub Copilot
Kiro
Junie
Resolve production
issues surgically
Analyze runtime issues, verify root causes, and validate fixes against live system behavior. Replace probability with clear evidence.
Security and privacy
Securely supporting the largest companies in the world across regulated industries
 Enterprise Compliance
ISO 27001 and SOC 2 Type II certified with GDPR and HIPAA alignment. Full RBAC, SSO, and audit logging.


Read-only execution with instrumentation isolation, without impact on production.
TLS 1.3 in transit and AES-256 encryption at rest, backed by AWS KMS with annual key rotation.


 Secure AI SRE Integrations
Read-only integrations with least-privilege access. Customer data is never modified.

 Data Privacy Controls
Configurable retention, PII redaction, prompt sanitization, and zero data retention with AI providers.
 IP & AI Protection
No source code storage, no model training on customer data, and strict execution guardrails.
 Tenant Isolation
Logical tenant separation, dedicated secret storage & fully isolated AI sandboxes.
AT&T reduced Time to Resolve incidents from
5 hours to 30 minutes avoiding costly war rooms

“The unique solutions that Lightrun is developing dramatically impact how developers operate.” Siris Singh, Global Head of Markets Strategic Investments

Taboola reclaimed 260+ hours of monthly engineering
capacity by eliminating manual reproduction

“When it comes to priority-one tickets, customers can’t wait days for a fix. Lightrun helps us reduce that to hours, that’s a huge win for us and for our customers.”
Hood Munaim SVP, Head of Product Engineering

Priceline increased developer productivity
by 30% across workflows over 2000+ services

“Lightrun not only saved us days, if not weeks, of painstaking debugging but provided an efficient approach to tackling complex issues in production.” Tomer Glicksman, SalesForce

Drata accelerated incident response velocity by 30% while maintaining strict compliance standards.

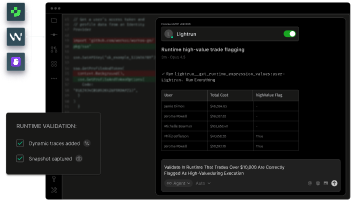
Inditex engineers used Lightrun’s live, dynamic logs and snapshots directly from their IDE to dig into a critical production issue and uncover a rounding bug quickly.

“The unique solutions that Lightrun is developing dramatically impact how developers operate.”
Siris Singh, Global Head of Markets Strategic Investments


Power every workflow with live runtime truth
100+ integrations, with no vendor lock-in.


