All The Visibility,
None Of The Risk
Debugging a live application requires caution and a delicate hand: every small change can snowball into a major incident.
Lightrun’s Developer Observability Platform connects to live applications safely and indirectly, giving developers back the power to figure out what’s actually happening under the hood.
Lightrun’s SDK™ can be deployed to multiple instances of the same application, regardless of where these applications are running.
For example, you can add Lightrun Logs to multiple instances of the same application running on an Azure VM, an EC2 Instance and a GCE VM – all at the same time.
Dissolve Performance Bottlenecks
Most tracers and performance tooling work on the service or application level, telling you which of your services are slow.
Lightrun foregoes traditional tracing in favour of metrics: code-level, on-demand measurements that tell you precisely which line of code, not which service, is taking too long to run.
Debug Third Party Libraries
Lightrun works in your supply chain just like it works inside your own code.
Add logs, metrics and snapshots across popular ORMs, web frameworks, SDKs and more – zero configuration required.
Pinpoint Every Complex Issue
Debug without mocks or reproductions – add more telemetry in real-time, with real state (configuration settings, specific user flows, etc…) to pinpoint exact behaviors reliably.
Use Lightrun where your application actually runs, to debug what actually happens.
Never Leave The IDE
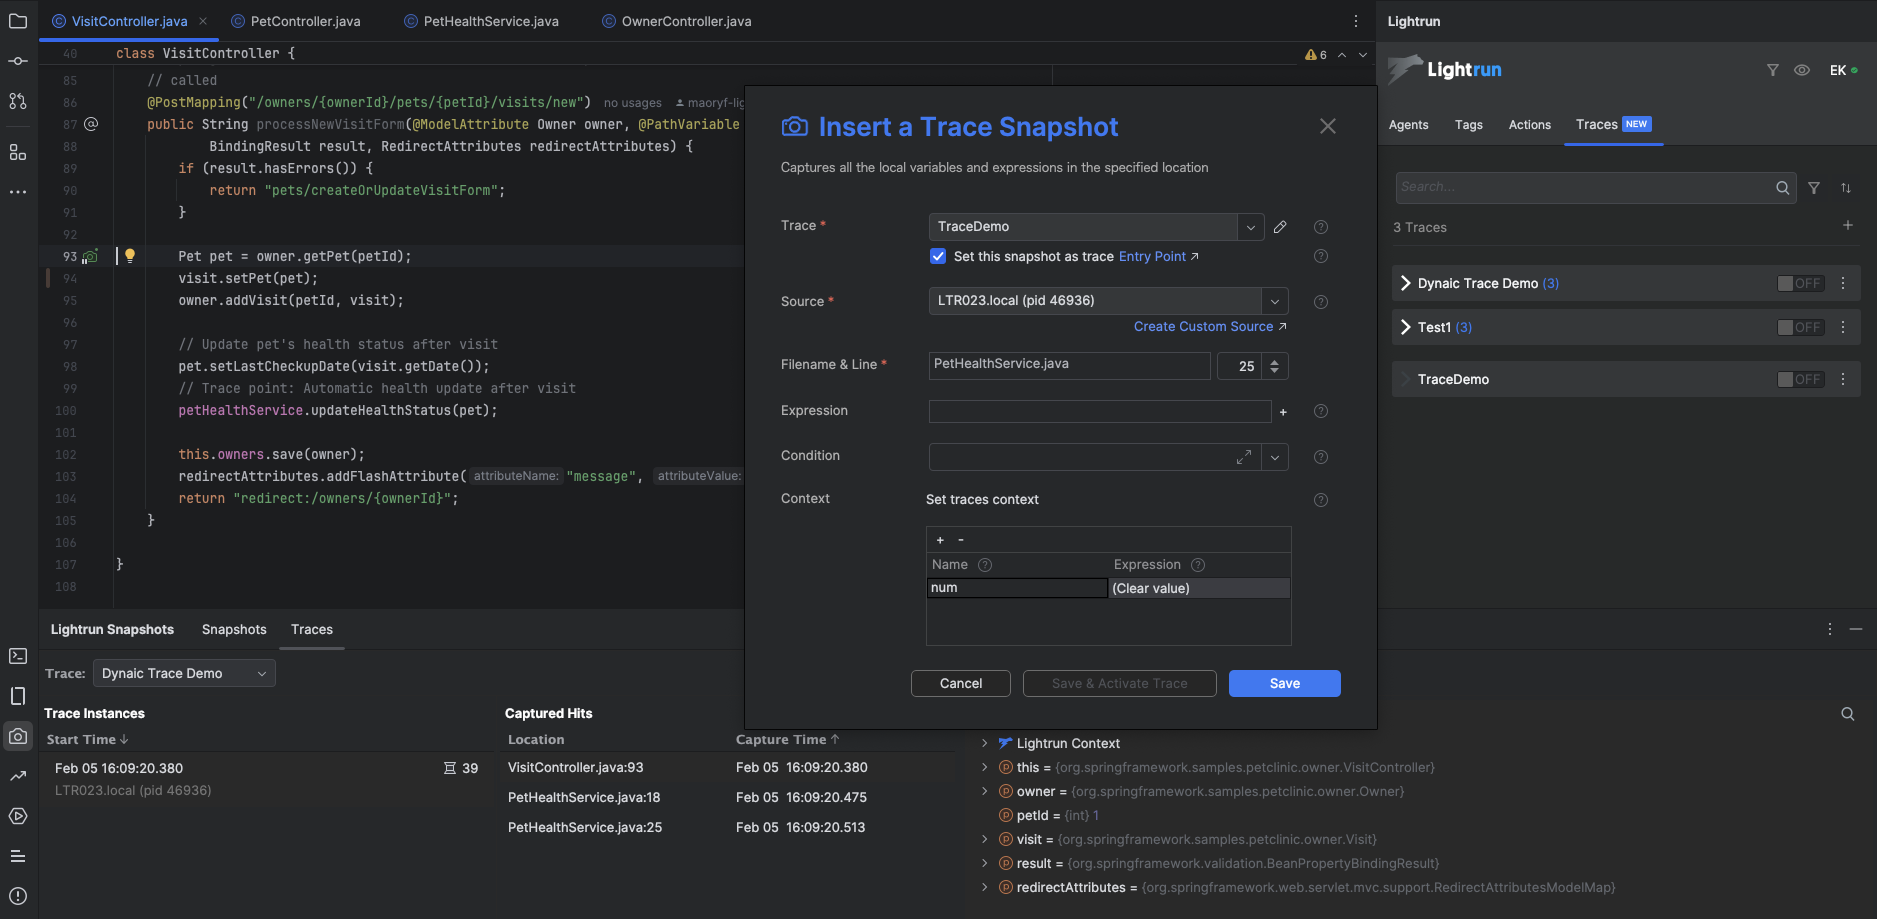
All Lightrun Logs, Snapshots and Metrics can be added and consumed directly from the IDE, without the need to open an external interface or changing contexts.
Download Lightrun today for your favorite IDE and see for yourself.
Get Down To Business
Let one of our Observability Specliasts walk you through the Lightrun platform.

