
Effectively Bridging the DevOps – R&D Gap without Sacrificing Reliability
DevOps culture revolutionized our industry. Continuous Delivery and Continuous Integration made six sigma reliability commonplace. 20 years ago we would kick the production servers and listen to the hard drive spin, that was observability. Today’s DevOps teams deploy monitoring tools that provide development teams with deep insight into the production environment.
“O brave new world That has such people in’t!” – William Shakespeare
Before DevOps practices were commonplace, production used to fail. A lot. We don’t want to go back to the time before DevOps tools were commonplace…

Everything’s Perfect in our Development Process, Right?
Well… No. Software is hard, especially at the fast pace of continuous delivery cycles. We will always make some bugs and unfortunately some will make it into production. That’s unavoidable.
The problem is that these bugs that made it into production made it past our continuous integration pipeline. They made it past the testing environment. They are typically tough to detect/reproduce bugs – Uber Bugs… The DevOps practices we worked so hard to establish suddenly turned against us.
That Thin (possibly blue) Line
DevOps teams are typically siloed from the dev teams. There’s a line that separates them. This isn’t too bad and fits well with agile development processes. But it falls flat when the development team needs to debug. This noticeably affects software quality. The DevOps approach indeed raised uptime significantly, but bugs in production are still abundant and they take longer to fix.
The Continuous Integration Churn
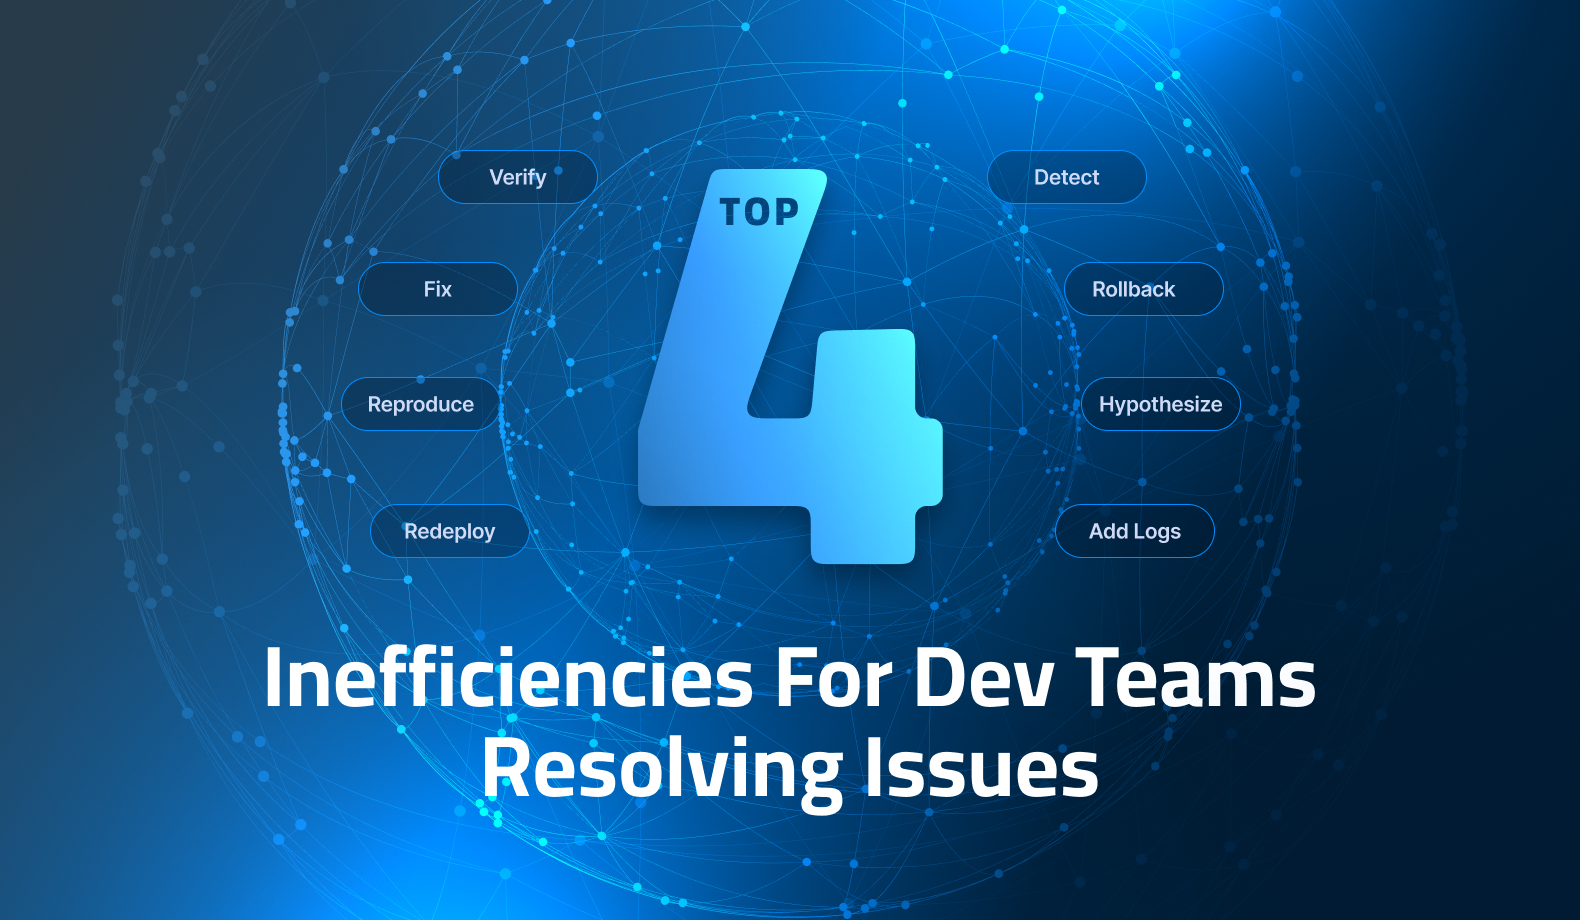
The first reason for this degradation is the continuous integration churn. When we have a bug in production, developers need to add logging/information and go through the continuous delivery pipeline to see the new logs. If they got something wrong or missed some information, it’s “rinse-repeat” all over again.
In a world of agile teams that move fast, this is a tedious and painfully slow process that puts the development cycle on-hold. While the continuous delivery pipelines are churning, we still have a production bug that we still don’t understand.
Access Limits and Security Teams
The second reason is more about the siloed teams, one of the core DevOps practices. I would like to emphasize that we obviously have and need a culture of collaboration. That’s obvious. But DevOps also has a responsibility of keeping the development environment separate from staging and production.
That line that separates DevOps engineers from R&D is a good line. It’s an important line. It’s a line that enables high-quality software by vetting everything that goes into production through an organized process.
Developers just want to connect a “debugger” and step over the code. This obviously doesn’t scale and would crash production systems. Then there are the obvious security issues involved… That’s why we have DevOps workflow and the silos are important.
Collaboration Between Development and Operations Teams
This isn’t a fresh problem. Rapid delivery and reliability engineering work great under normal conditions, but fall flat when we need to track an error. At that point, we have two options: logs and observability tools. Before I proceed, I would like to stress that we use both and love them. They are crucial pieces of the software development lifecycle!
Logs
Today’s logs are not the logs of our predecessors. DevOps pipe, filter and index them at a huge scale. In fact, corporations spend millions on log ingestion cloud infrastructure!
Working with logs has some limits:
- Cost – over-logging is a major problem. It degrades application performance and can be quite expensive
- It’s Static – developers aren’t clairvoyant. They don’t know what to log, that’s why they over-log. Still, some information is often missing, and it sends us back to the continuous deployment cycle mentioned above
Observability Tools
There are many observability tools in production, but most of them have one thing in common: they were designed as part of the DevOps toolchain. They weren’t designed for R&D and don’t provide the type of information developers often seek.
Most of these tools are focused on Metrics and Errors. That makes sense for a DevOps practitioner, but a production bug is often-times expressed in application logic/UI.
Finally, the performance of applications can be affected by such observability tools. These tools work by monitoring widely and receiving application events. Their overhead is often noticeable in intense production environments.
Continuous Observability Tools to Save the Day
The problems aren’t new. As a result, the market grew to offer a tool for developers that respects DevOps processes. A debugger that respects security practices and reliability engineers.
Continuous Observability tools are the new generation of Cloud-Native development. They let developers query the running system at the code level without deploying a new version.
Let’s go over the issues above:
- Log cost – Continuous Observability tools let us inject logs dynamically. That means developers can reduce the amount of logs (developers can inject more as needed)
- CI/CD cycle for updates – Since logs can be injected, developers don’t need to go through the continuous deployment pipeline
- These tools were designed for developers and integrate with development tools such as IDEs. They provide the type of information developers need directly in the source code
- Performance overhead is low. Since these tools query a specific area of the code and not the full application, the impact is low. The best tools throttle features to keep the application performant
The Line Preserved
Continuous Observability tools are deployed through the DevOps environment. That means developers don’t circumvent the operations teams and we maintain the separation that protects the system reliability. Software updates and all maintenance still propagate through a single team of DevOps like it did before.
This is great news if you’re as passionate about reliability engineering and cloud-native development as I am. The capability and reliability of the tool lets us keep the pace of releases and literally debug production at scale without compromising security.
In Practical Terms – How does it Work?
Common tool usage in this field follows a use case similar to a debugger in normal application development. A problem is reported in production and the application development team makes assumptions about the application. These assumptions can be verified using Snapshots, Logs or Metrics (AKA actions).
Snapshots are the workhorse of continuous observability tools, they provide a deep view into the underlying infrastructures. Snapshots work very much like a breakpoint; they provide a stack trace with the values of the variables within the stack frame contexts. As a result they even look like an IDE breakpoint within the IDE. But they have one distinction: they don’t break. The current thread doesn’t stop and doesn’t affect other threads.
This means there’s no “step-over” which is understandable. But there are conditional actions that let us place a snapshot (or any action) based on a condition similar to a conditional breakpoint. E.g. a snapshot can be defined, so it’s triggered only for a specific user to track an issue experienced by that user only. We can place it on a group of servers using a tag so we can track an issue between distributed servers.
Logs, let us add logs and integrate with existing ones seamlessly. That’s a key capability since logs are best read in context/order. They also get ingested with the rest of the logs based on the definitions made by the DevOps team.
Metrics let us measure small blocks of code or methods. These are very fine grained measurements even things as simple as a counter can be very useful.
TL;DR Applying Continuous Observability into your Agile Practices
Modern cloud environments are remarkably complex. As we’re all adopting cloud-native development, we can’t give developers the level of access they used to enjoy into production. That’s just not tenable. Everything must follow key practices through the DevOps Lifecycle.
This leaves us with a system that’s robust for most cases but much harder to debug and troubleshoot. Organizational culture helps, but it isn’t enough. Bugs that quality assurance didn’t grab are the hardest bugs and analyzing them in production based on customer feedback is hard. It’s time consuming, expensive, affects release frequency and code quality.
Existing tools are great, but they were designed for DevOps teams, not for developers. Bugs should be the responsibilities of the development team, but we can’t expect developers to address bugs without tools that provide insight…
This is the idea behind continuous observability tools. These tools are not a part of a DevOps platform but they’re deployed by DevOps. In that sense, they maintain the separation. Developers don’t have access to production. They can debug it though… Securely and at scale.
It’s Really not that Complicated.
You can actually understand what’s going on inside your live applications.


